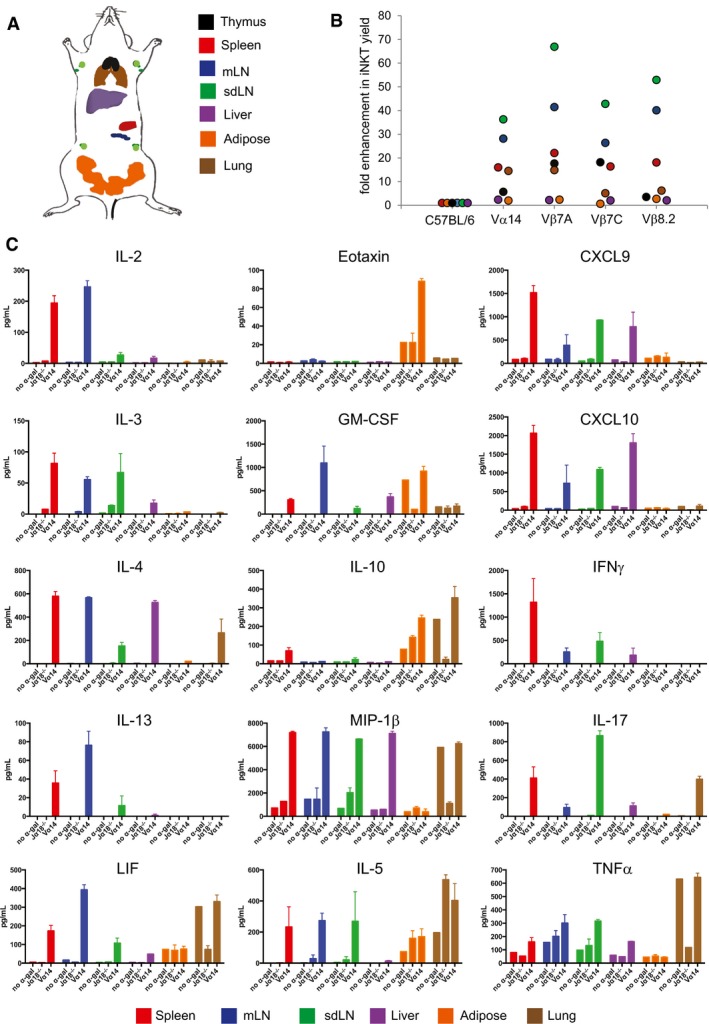
Figure 1. iNKT TN mice have increased numbers of tissue‐resident iNKT cells.

- Diagram representing the placement of various tissues analyzed for iNKT cells. mLN = mesenteric lymph node; sdLN = skin‐draining lymph node.
- Relative iNKT cell yield in various tissues from TN mouse lines compared to C57BL/6 mouse lines. Tissues were isolated from indicated C57BL/6 or iNKT TN mouse lines and stained with anti‐CD3 and CD1d‐(PBS57)‐tetramer.
- Spleen, mLN, sdLN, liver, adipose, and lung lymphocytes from Jα18−/− or Vα14 mice were stimulated in vitro with RAW‐CD1d cells and 1 μg α‐GalCer. An additional sample of Vα14 lymphocytes from each organ was plated with RAW‐CD1d cells but no α‐GalCer. Supernatants were collected after 24 h and cytokine concentration determined by cytokine bead array. Error bars are SD of mean values from three different mice per group. Results shown are representative of two independent experiments where n = 3 biological replicates.
