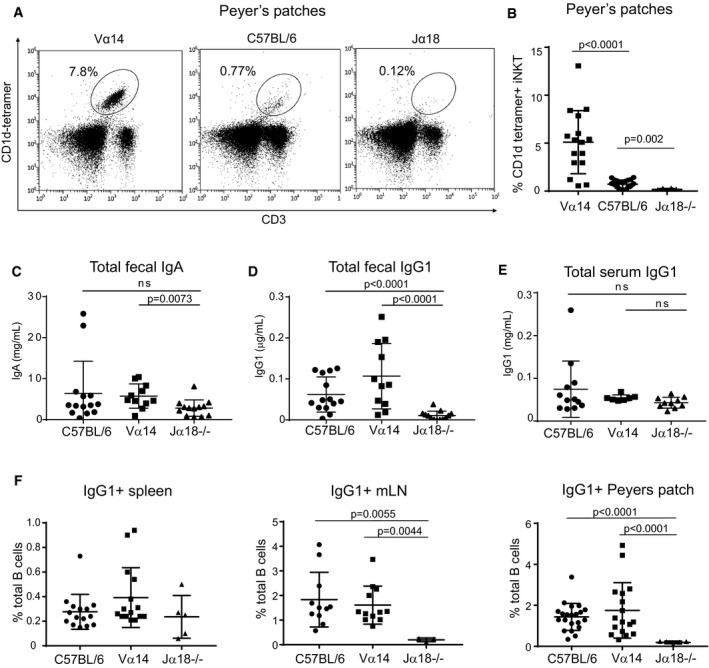
Figure 3. iNKT TN mice show increased IgG1 production and IgG1+ B cells in the mLN and Peyer's patches.

-
ALymphocytes from Peyer's patches of C57BL/6 and Vα14 mice were stained with anti‐CD3 and CD1d‐(PBS57)‐tetramer.
-
BPercentage of lymphocytes that were CD3+CD1d‐tetramer+ iNKT cells among Peyer's patches of C57BL/6, Vα14, and Jα18−/− mice are shown. Mann–Whitney test. Error bars are SD. C57BL/6 n = 22; Vα14 n = 16; Jα18−/− n = 8.
-
C–EMice were analyzed for total fecal IgA (C), total fecal IgG1 (D), or total serum IgG1 (E) by ELISA. Mann–Whitney test. Error bars are SD. C57BL/6 n = 14; Vα14 n = 11; Jα18−/− n = 13.
-
FPercentages of total B cells that were IgG1+ in the spleen, mLN, and Peyer's patches of C57BL/6, Vα14, and Jα18−/− mice are shown. Mann–Whitney test. Error bars are SD. C57BL/6 n = 15; Vα14 n = 15; Jα18−/− n = 5.
