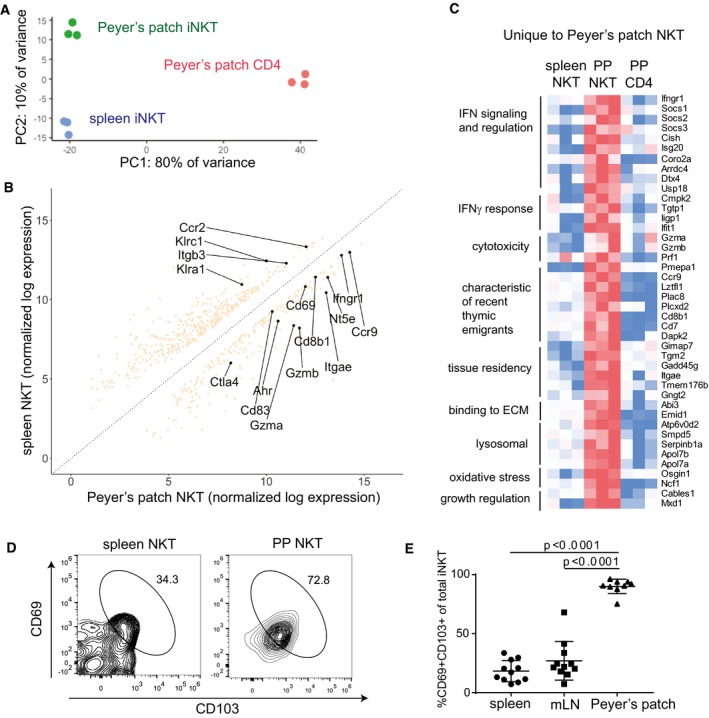
Figure 7. PP‐iNKT cells exhibit a unique gene expression profile compared to spleen iNKT and PP CD4+ cells.

- Principal component analysis of RNAseq samples from biological replicates of PP‐iNKT, spleen iNKT, and PP CD4+ cells
- Differential expression analysis comparing transcriptomes of spleen iNKT cells versus PP‐iNKT cells.
- Heatmap of FPKM values from genes uniquely upregulated in PP‐iNKT cells as compared to both spleen iNKT and PP CD4 cells. Red indicates higher expression, and blue indicates lower expression.
- Spleen and PP cells from Vα14 TN mice were stained with the indicated antibodies, analyzed by flow cytometry, and gated on CD1d‐(PBS57)‐tetramer+ CD3+ cells.
- Quantification of data from (D), n = 11 mice per group. Mann–Whitney test. Error bars are SEM.
