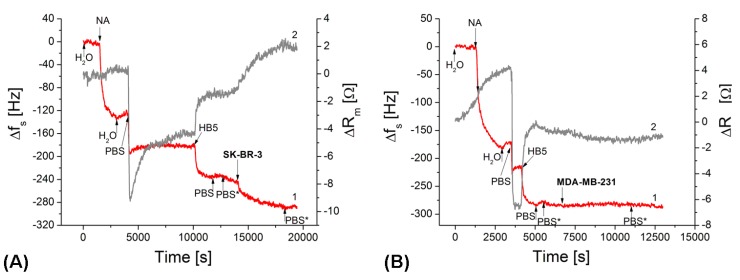
Figure 4.
The kinetics changes of the series resonant frequency, Δfs, (curve 1) and motional resistance, ΔRm, (curve 2) of TSM transducer following addtion of NA (125 μg/mL), HB5 aptamers (0,25 μM) and SK-BR-3 cells (A) or MDA-MB-231 cells (B). The concentration of the cells was 5 × 10⁴ cells/mL. The arrows indicate addition of respective compounds as well as washing of the surface by water, PBS and by PBS with addition of aliquote volume of DMEM (PBS*).

