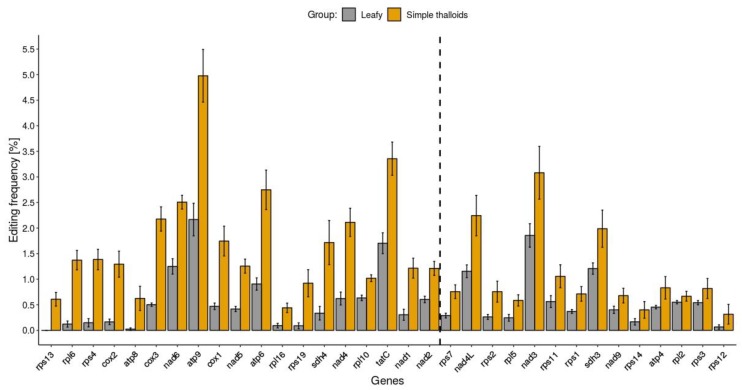
Figure 2.
Predicted C-to-U editing frequency of liverwort genes. Bar plots depicting mean editing frequency of leafy (n = 8) and simple thalloid (n = 5) liverworts are colored by liverwort group. Genes are sorted in ascending order (left to right) of statistical significance of differences between editing frequencies. The significantly different (p-value < 0.05) editing frequencies are depicted on the left side of vertical dashed line. The bar plot whiskers depict standard error values.

