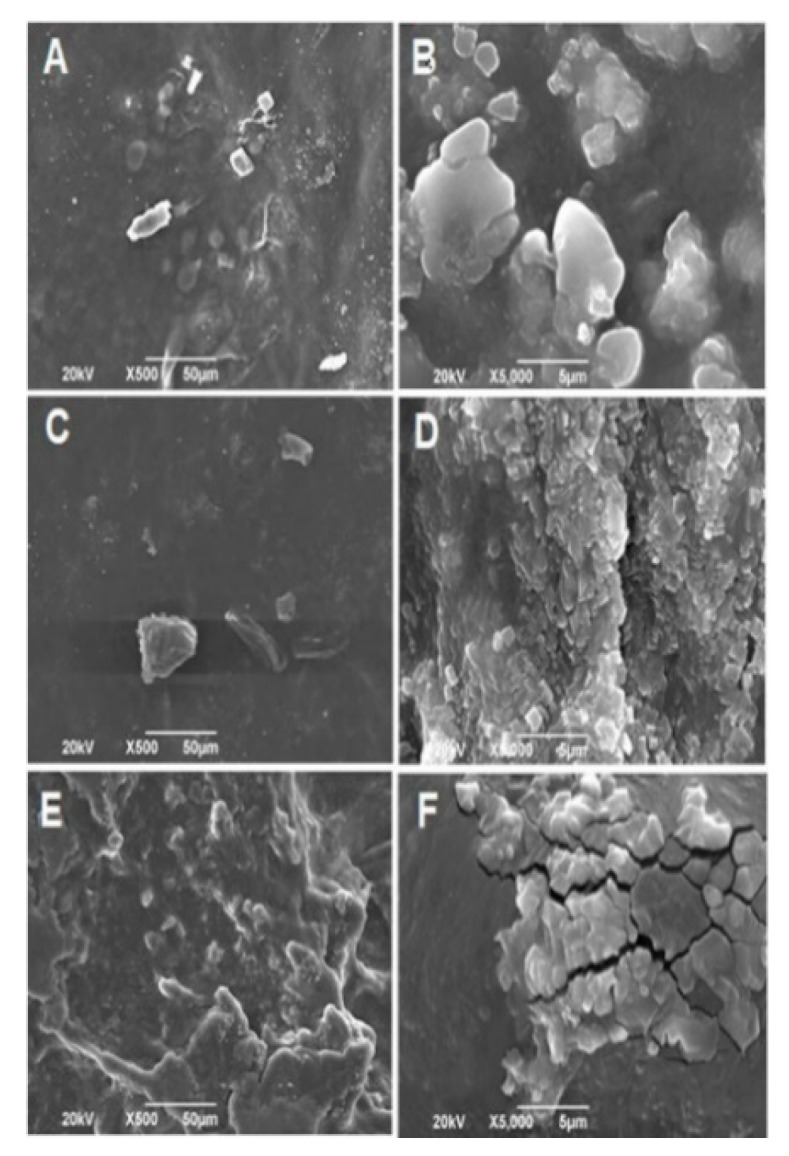
Figure 5.

SEM images of the electrospun CS/PVA/GO composite nanofibrous membranes after fourteen days in the degradation process in SBF. (A,B) 0% GO, (C,D) 0.5% GO, and (E,F) 1.0 % GO. Images (A,C,E) at 500×, and images (B,D,F) at 10,000×. For all the experiments, the voltage used was 20 kV.
