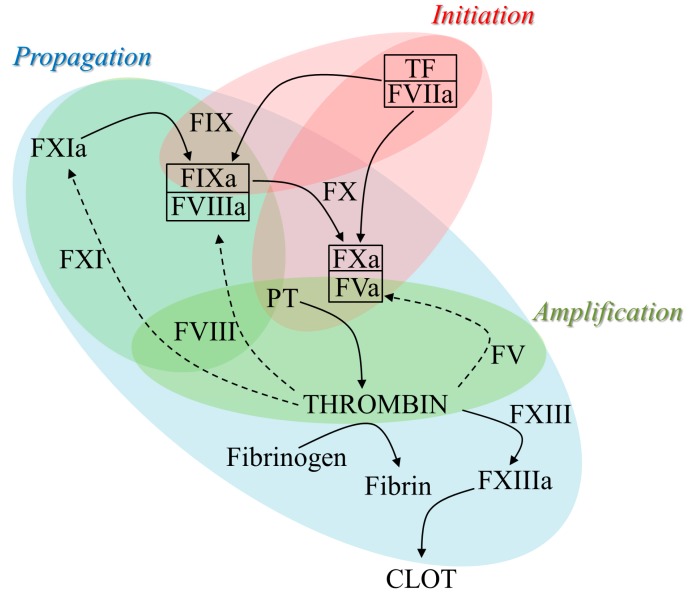
Figure 1.
The series of enzymatic reactions in the coagulation cascade. Schematic representation of the coagulation cascade, showing the several direct (black rows) or feedback (dotted rows) reactions that can be subdivided into initiation (red), amplification (green) and propagation (blue) phases, ultimately leading to the fibrin clot. Boxed items indicate the interaction of active enzymes (FVIIa, FXa, FIXa) with their cofactors (TF, FVa, FVIIIa). F, factor; a, activated form; PT, prothrombin; TF, tissue factor.

