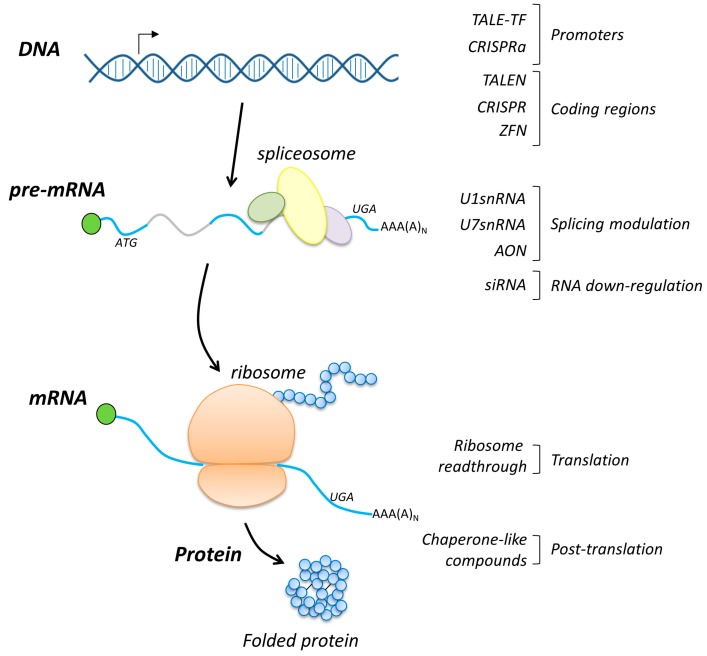
Figure 2.
Overview of the interventions at the DNA, RNA and protein levels. Schematic representation of the DNA–RNA–protein flow (left) as well as of the corresponding molecular approaches with the indicated level at which each strategy works (right). In the pre-mRNA scheme, exons and introns are indicated in cyan and grey, respectively.

