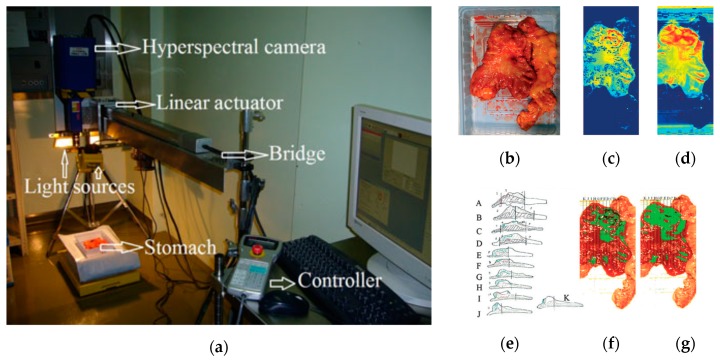
Figure 6.
Gastric cancer detection acquisition system, cancer detection results using the NDCI and integral filter, and comparison with histopathological results obtained in [116]. (a) HS acquisition system setup; (b) RGB representation of the ex-vivo sample; (c) Cancer enhanced regions using an integral filter in the hyperspectral image (1057–2440 nm); the tissues are shown in a blue to red spectrum, where the red regions represent the tumor; (d) Cancer enhanced regions using NDCI; (e) Pathological sectioning and results; (f) Detected tumor using an integral filter; (g) Detected tumor using NDCI. Reproduced with permission from [116]; published by Wiley (2011).

