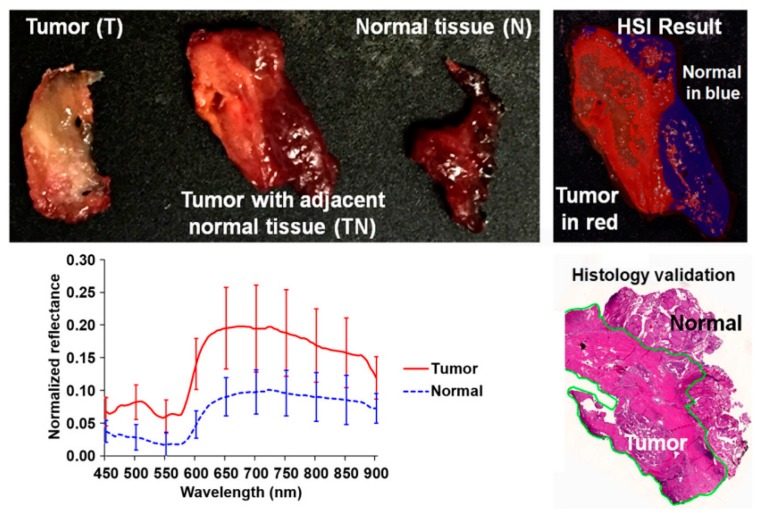
Figure 8.
Preliminary results obtained in the tumor margin delineation for head and neck cancer [138]. After hyperspectral image acquisitions (top-left), the tissue was processed histologically, and tumor margins were outlined on the pathology image (bottom right) by a pathologist, which was used to validate the results of the classification (top-right). The average spectral curves are shown at the bottom left for each type of tissue, i.e., tumor, normal, and tumor with adjacent normal tissue. Reproduced from [138]; Creative Commons BY 4.0; published by SPIE (2017).

