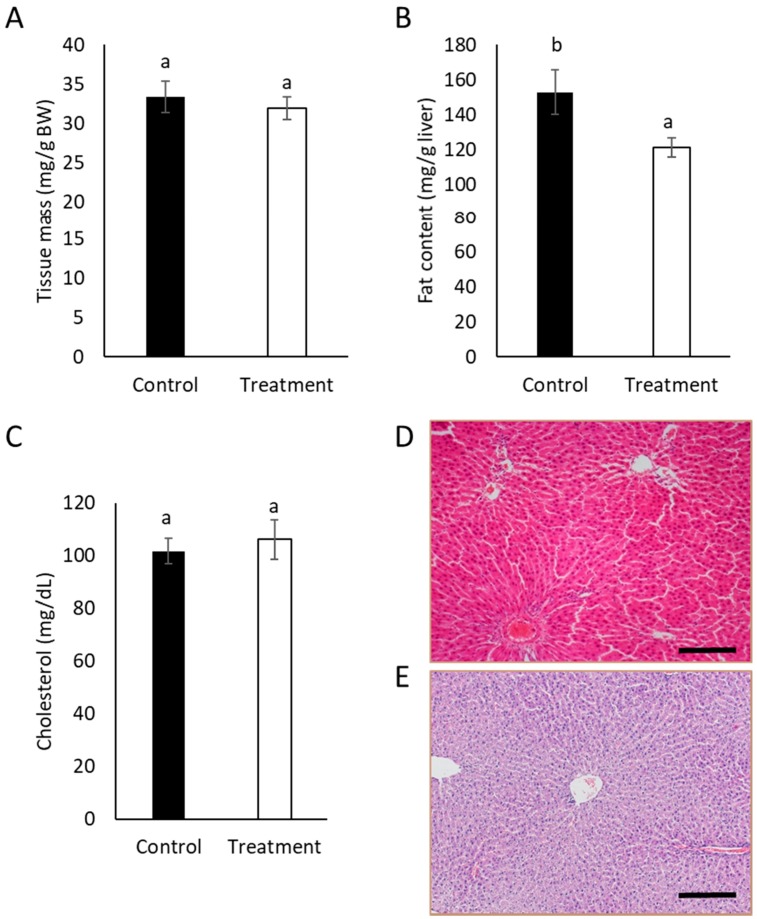
Figure 1.
(A) Tissue mass (g/g BW), (B) fat content (mg/g liver), and (C) cholesterol content (mg/dL) of livers from control and treated animals. Data expressed as mean ± SE. Different letters indicate significant differences between groups (t test, p < 0.1). Hematoxilin-eosin staining of formalin-fixed samples of the liver of a control rat (D) and a rat treated with SCGs (E). Samples were obtained on the 29th day. Bar 200 μm.

