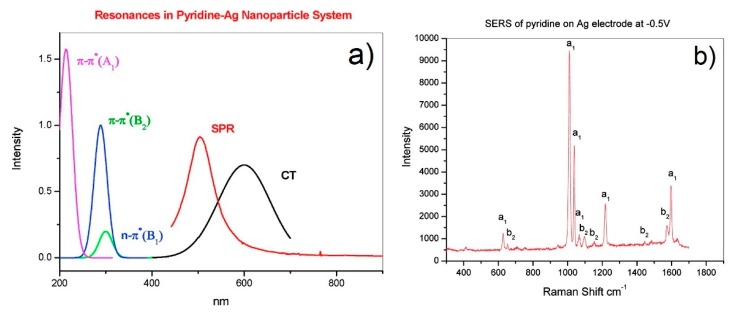
Figure 5.
(a) Spectral distribution of the plasmonic (red line), charge transfer (CT, black line), and intramolecular (green, blue, and violet lines) resonances for pyridine adsorbed on silver. Reprinted (adapted) with permission from Lombardi et al. [9]. Copyright (2008) American Chemical Society. (b) SERS spectrum of pyridine on silver. Reprinted (adapted) with permission from Lombardi et al. [137]. Copyright (2008), American Chemical Society.

