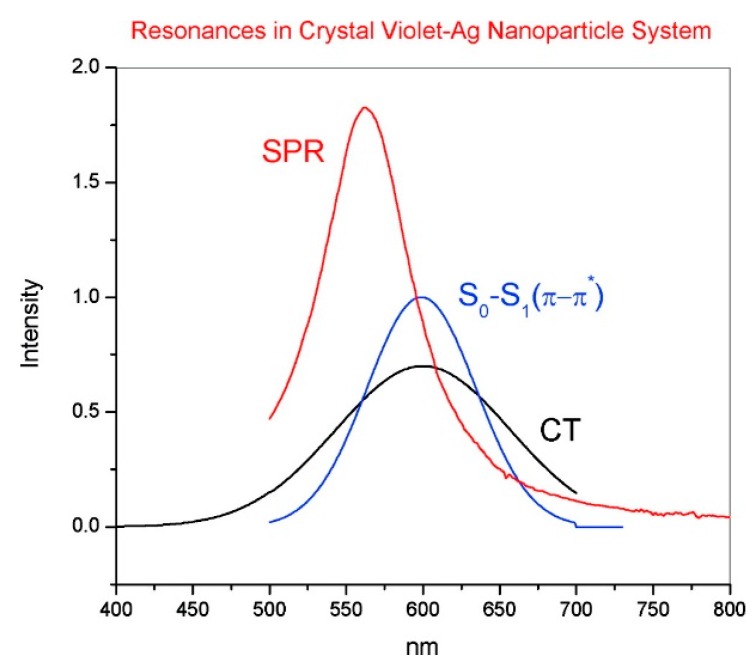
Figure 6.
Spectral distribution of the plasmonic (red line), CT (black line), and intramolecular (blue line) resonances for CV+ adsorbed on silver. Reprinted (adapted) with permission from Lombardi et al. [9]. Copyright (2008) American Chemical Society.

