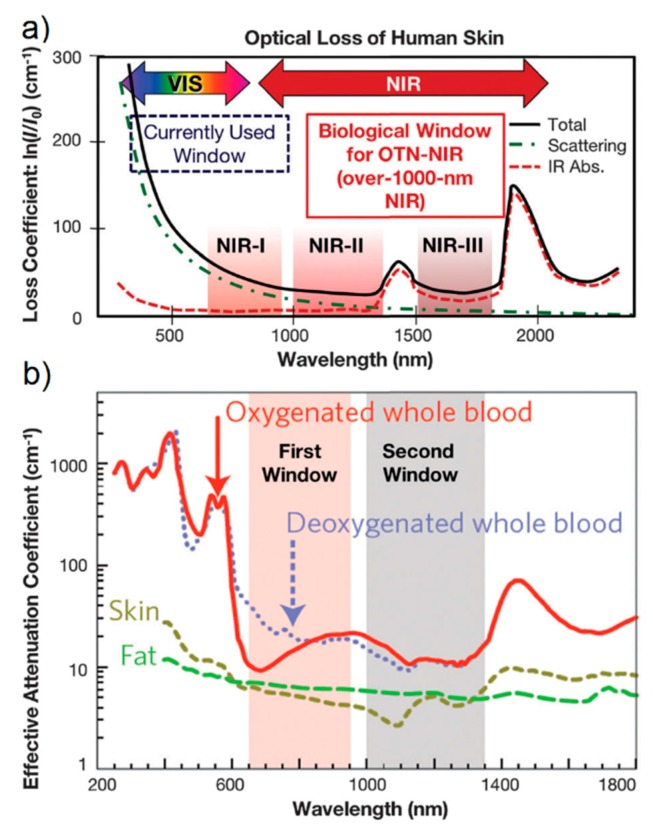
Figure 16.
(a). Absorption (dash red line), scattering (dash-dot green line), and extinction (solid black line) of human skin as a function of the wavelength. The three transparency windows are indicated as NIR-I, NIR-II, NIR-III. Reproduced with permission from Hemmer et al. [276]. Copyright (2013), the Royal Society of Chemistry. (b) Extinction coefficient of oxygenated blood (solid red line), deoxygenated blood (dotted blue line), skin (ochre dash line), and fatty tissues (green dash line). Reproduced with permission from Smith et al. [277]. Copyright (2009), Macmillan Publishers Limited.

