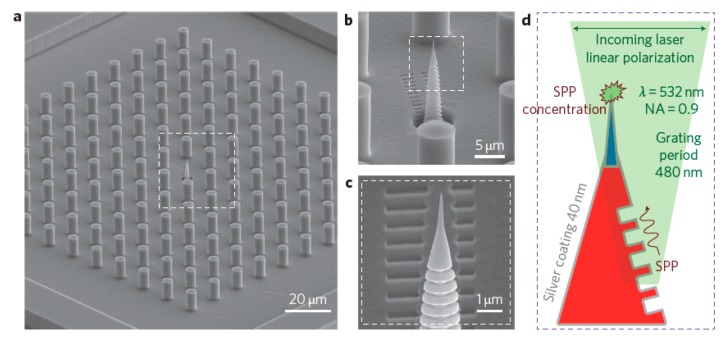
Figure 36.
(a) SEM image of the super-hydrophobic structure with the nanotip in the center; when a drop of solution is deposited on this device, the high contact angle between the super-hydrophobic structure and the drop causes the analyte to concentrate on the nanotip during the evaporation process; (b,c) detailed SEM images of the nanotip; (d) a laser illuminates the nanotip generating a surface plasmon that propagates upwards and concentrates at the top of the nanotip. The large electromagnetic field produced allows the SERS detection of the analyte. Reproduced with permission from De Angelis et al. [352], (2011) Macmillan Publishers Limited.

