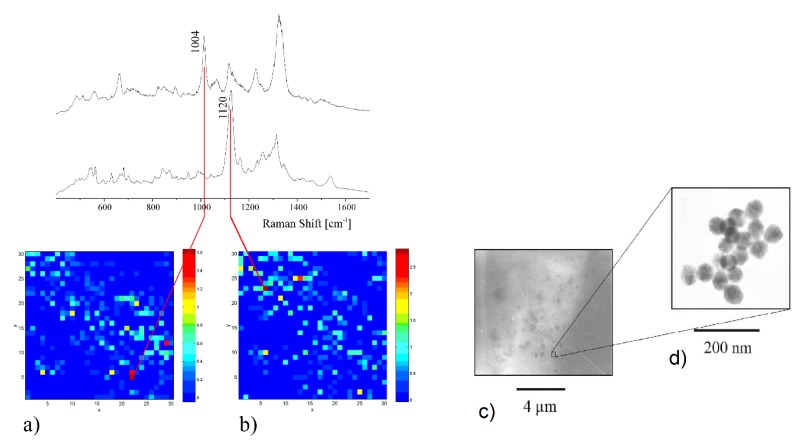
Figure 47.
Example of SERS imaging. Distribution of the maximum Raman signal of phenylalanine, Phe– at 1004 cm−1 (a) and DNA, O–P–O DNA backbone at 1120 cm−1 (b) over a 30 × 30 mm2 cell. The maximum of the two Raman signal occurs at different places considering that DNA is mainly located in the cell nucleus, while phenylalanine should be mainly present in the cytoplasm. Electron micrograph of Au nanoparticles inside a cell (c). Magnification showing 60-nm gold colloidal sphere aggregates (d). Reproduced with permission from Kneipp et al. [453]. Copyright (2002), Society for Applied Spectroscopy.

