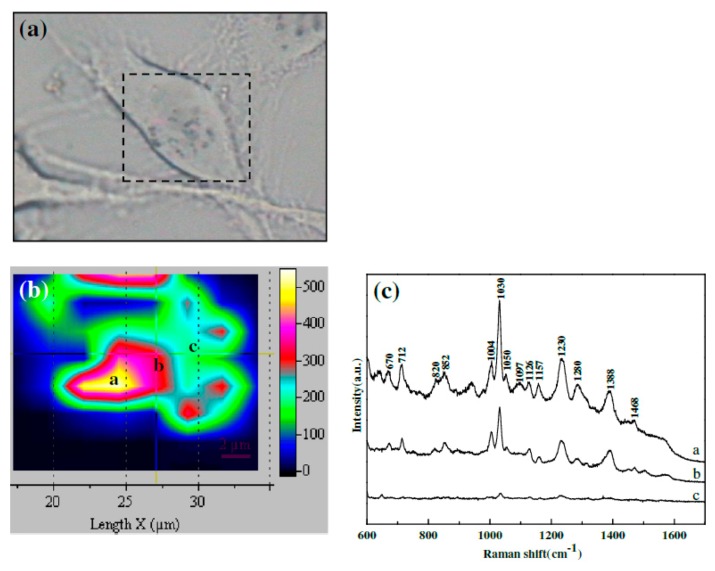
Figure 51.
Photomicrograph of a fixed breast cancer cell (a) and SERS mapping image (b), obtained by recording the Raman signal at 1030 cm−1 in the rectangle region, with 10 × 10 μm2 dimension (outlined in micrograph (a)). The Raman signal at 1030 cm−1 corresponds to the C–H in-plane bending mode of phenylalanine. SERS spectra recorded in position (a–c) of the labelled area (c). Reproduced with permission from Zhu et al. [456] under Creative Commons 2.0 license (https://creativecommons.org/licenses/by/2.0/).

