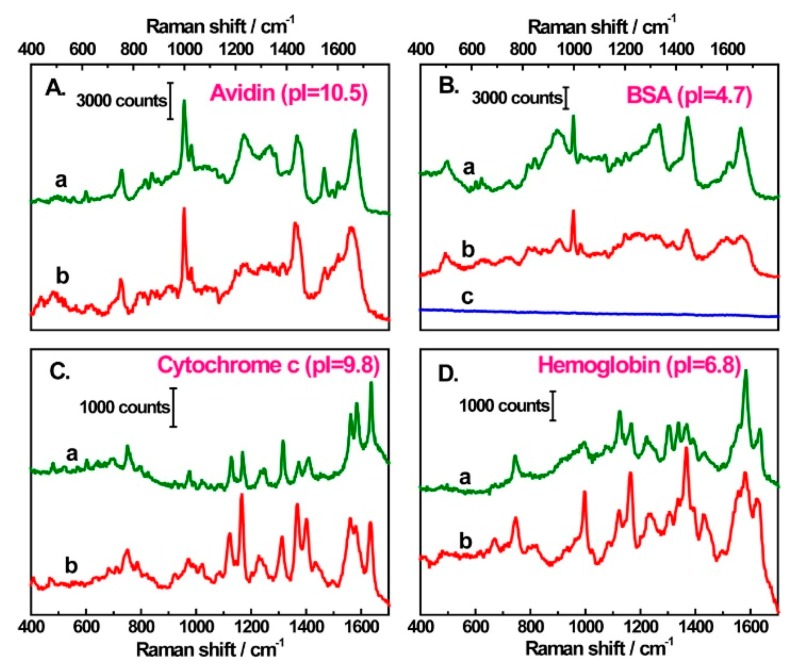
Figure 52.
Comparison of the normal Raman (green line, a) and amplified SERS spectra (red line, b) of Avidin (A), BSA (B), Cytochromo c (C), and Hemoglobin (D). SERS spectra are obtained with the iodide-modified Ag nanoparticles method, using sample concentrations of 300, 300, 3, 30 μg/mL, respectively, aggregated by MgSO4. The blue line c, in BSA spectra (B), evidence the aggregation effect: No Raman signal is detected before aggregation. Raman spectra of avidin, BSA, and Hemoglobin solid are obtained with 20 mW laser power and 30 s acquisition time. Reproduced with permission from Xu et al. [465]. Copyright (2014), the American Chemical Society.

