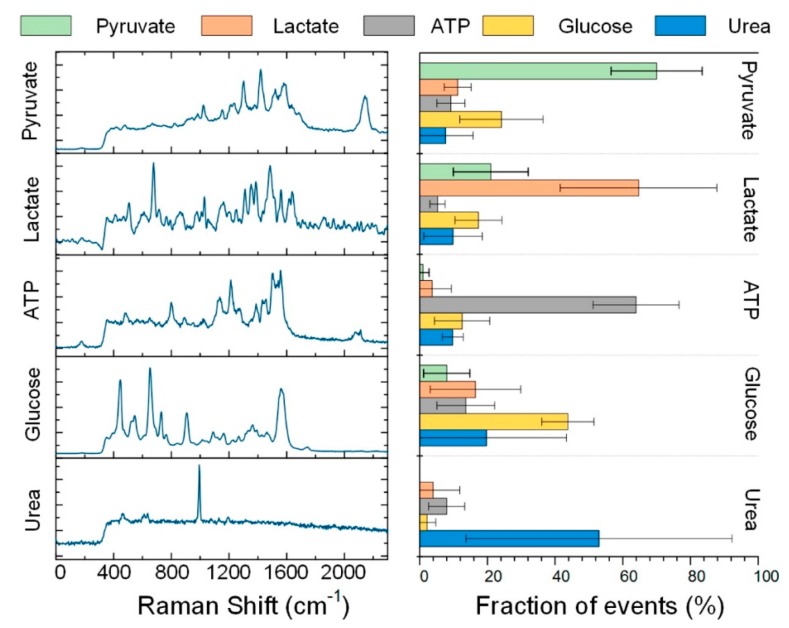
Figure 56.
SERS spectra of pyruvate, L-lactate, adenosine triphosphate (ATP), D-glucose, and urea generated by principal component analysis (PCA) of a standard solution (left). These spectra were used to build SERS spectra database. Evaluation of the selectivity of the chemometric algorithm (right). SERS measurements were performed on five SERS nanosensors with a fresh standard solution of the target molecule. The error bars indicate standard deviation. Reproduced with permission from Lussier et al. [459]; further permissions related to the material excerpted should be directed to the ACS. Copyright (2016), the American Chemical Society.

