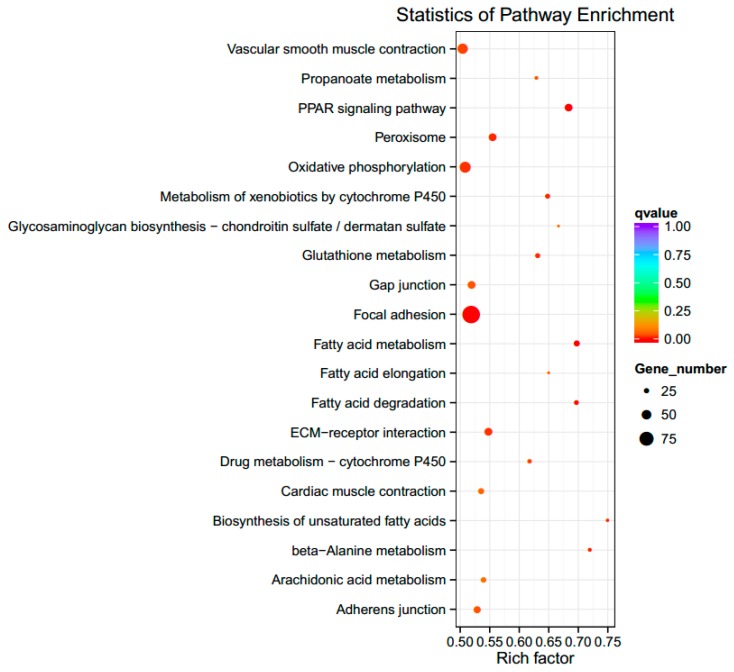
Figure 3.
The top 20 significantly enriched functional KEGG pathways. Note: The size of the dot represents the number of differentially expressed genes in the pathway. The color of the dot corresponds to different ranges of q-value (corrected p-value < 0.05). The vertical axis represents the enriched pathways. Rich factor refers to the ratio of the number of differential genes enriched to the number of annotated genes enriched in the pathway. The higher the rich factor value, the greater the enrichment degree will be. PPAR: peroxisome proliferator-activated receptor, ECM: extracellular matrix.

