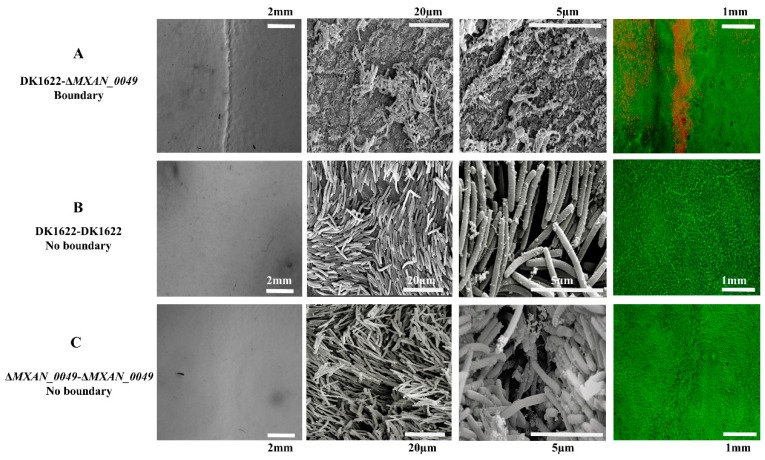
Figure 1.
Status of boundary cells by LIVE/DEAD cell viability assay and SEM. At different magnifications, we observed the status of the cells at the point of interaction between DK1622 and ΔMXAN_0049, where a visible boundary appeared (A). At the point of interaction between same strains, DK1622-DK1622 and ΔMXAN_0049-ΔMXAN_0049, no boundary appeared (B,C). Cells within the boundary had irregular and damaged forms compared to the non-boundary, where cells were shown in a regular rod shape at 20 µm and 5 µm. LIVE/DEAD assay: the red line represents the damaged cells as the boundary at 1 mm (A), while the green color shows the active cells in the surrounding area (B,C).

