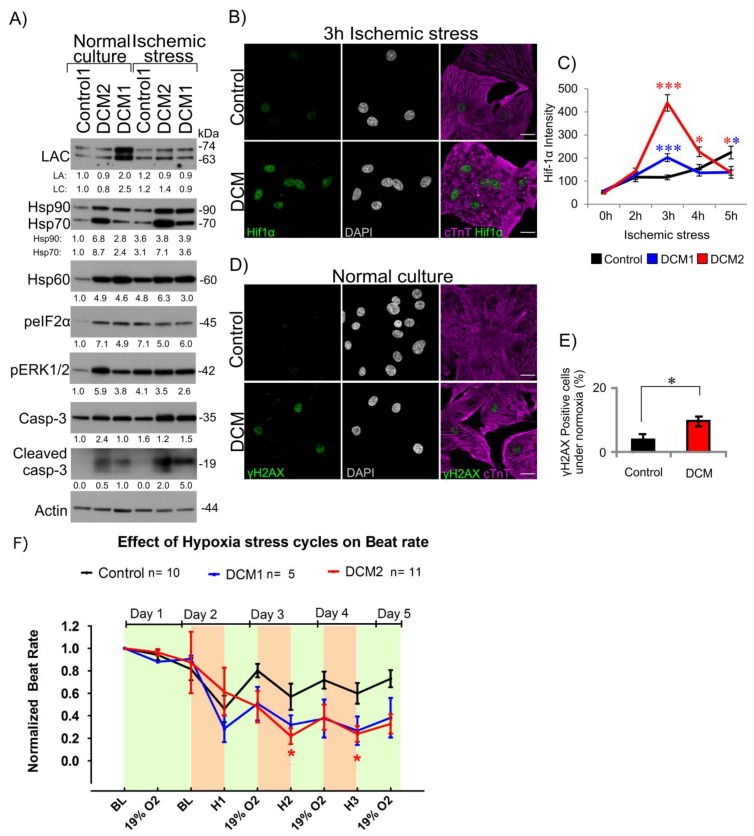
Figure 5.
DCM hiPSC-CMs show increased elevated cellular stress. (A) Western blot analysis of lamin A/C, phospho-eIF2α (peIF2α), Hsp90, Hsp70, Hsp60, phospho-ERK1/2 (pERK1/2) and cleaved caspase-3 under normal culture conditions and after exposure to ischemic stress for 3 h. Actin was used as a loading control. The average numerical values of signal intensities relative to the loading control (actin) are shown below each blot. n = 2 individual experiments. Control2 hiPSC-CMs were not qualified for analysis due to lower differentiation efficiency compared to other lines. (B) Confocal microscopy analysis of Hif-1α intensity. Control1, DCM1 and DCM2 hiPSC-CMs were cultured either in normal culture conditions or exposed to ischemic stress for 2 h, 3 h, 4 h and 5 h, fixed and stained for Hif-1α, cardiac marker cTnT and DNA (DAPI). A 3 h time point is shown. Scale bar 20 µm. (C) The fluorescence intensities of Hif-1α were determined from all the confocal sections of >15 randomly selected cells at different time points and the average normalized signals were plotted. (D) Control1 and DCM2 hiPSC-CMs were cultured under normal culture conditions, fixed and stained for γH2AX, cTnT and DNA (DAPI). (E) γH2AX positive cells from control1 and DCM2 were counted and plotted (n = 500). (F) Effect of three repeated 3 h cycles of hypoxia (1% O2) shown as H1, H2 and H3 and overnight re-oxygenation (19% O2) on beat rate of hiPSC-CMs recorded on MEA. Control data presented in F is combined from Control1 and 2. Data is expressed as mean ± s.e.m., (*) p < 0.05, (**) p < 0.01 and (***) p < 0.001.

