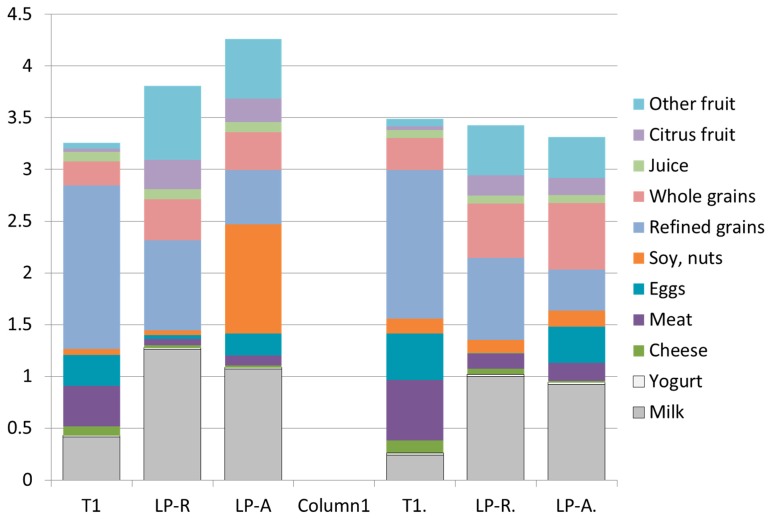
Figure 2.
A comparison of breakfasts associated with the bottom (T1) tertile of dietary nutrient density NRF9.3 scores and breakfast patterns created by LP models. Data are presented separately for children (left) and for adults (right) in NHANES 2011–2014. The Y axis shows MyPlate units (cup equiv and/or oz equiv).

