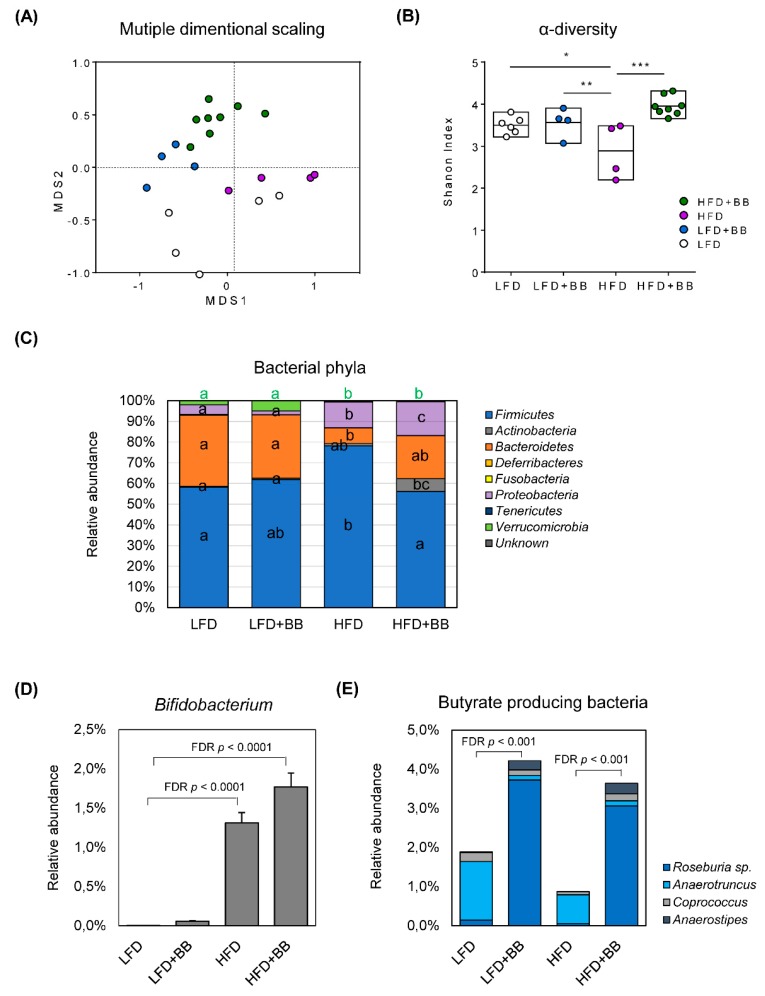
Figure 6.
Gut microbiota community of rats in response to experimental diets. (A) Microbiota composition in cecal sample was assessed by 16S rDNA analysis with multidimensional scaling analysis, where each symbol represents an individual sample. (B) Bacterial community diversity (represented by Shannon index at genus level) (C) Bars representing each diet group, show the distribution of bacterial phyla in the microbiota. Values are mean relative abundance of each bacterial phylum (n = 4–8). Significance was determined by using ANOVA followed by Tukey’s post-hoc test and corrected for multiple comparisons with false discovery rate control (FDR). Different letters indicate significance. (D,E) The relative abundance of Bifidobacterium sp. and butyrate-producing bacteria of cecal microbiota (n = 4–8).

