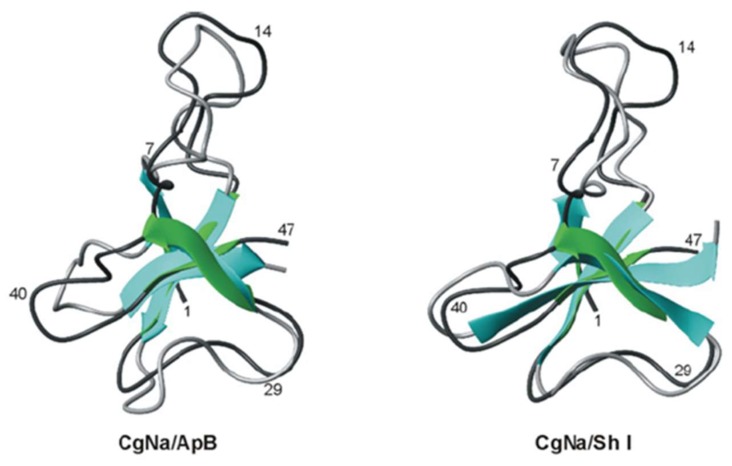
Figure 5.
Superimposed cartoon representation of the structures of CgNa (Δ-actitoxin-Cgg1a) and ApB (left) and CgNa and ShI (Δ-stichotoxin-She1a) (right). CgNa is coloured green and dark grey. Figure modified with permission from Biochemical Journal; published by Portland Press, 2007 [118].

