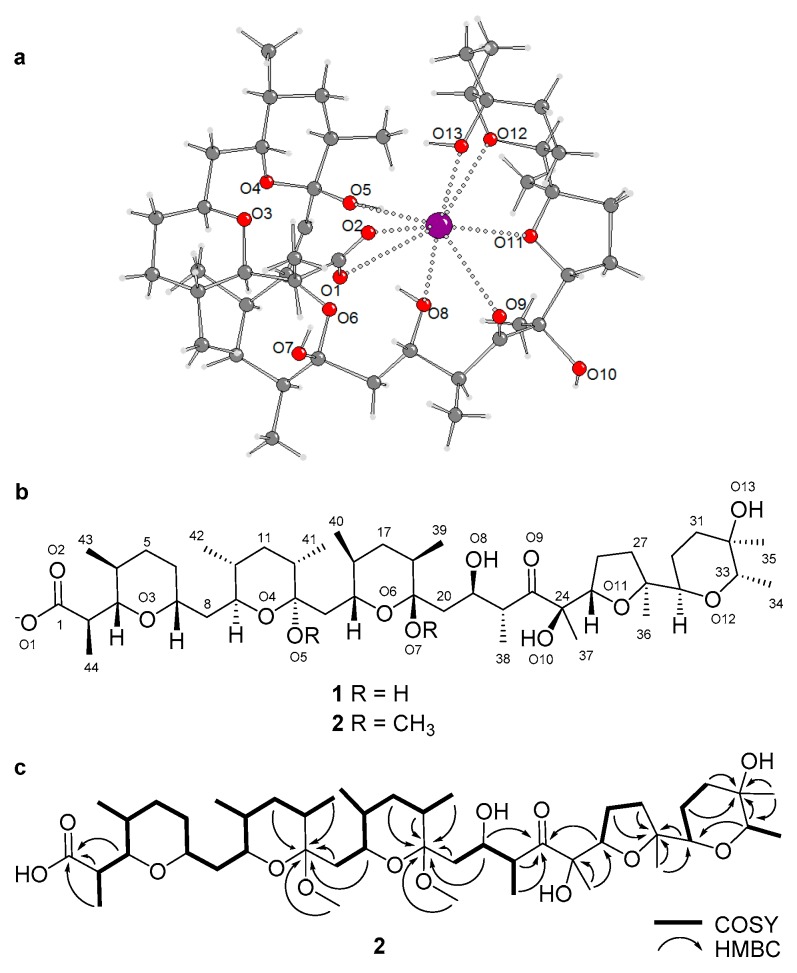
Figure 3.
(a) Crystal structure of terrosamycin A (1) showing one of the independent molecules in the asymmetric unit. Dotted bonds depict the coordination bonds between oxygen (red) and potassium (purple). (b) Molecular structure of the terrosamycin A (1) and B (2) anions. (c) Key COSY and HMBC correlations used to elucidate the structure of terrosamycin B (2). Similar correlations were used to confirm the structure of terrosamycin A. The numbering scheme used for the crystal data is consistent with the 2D structure.

