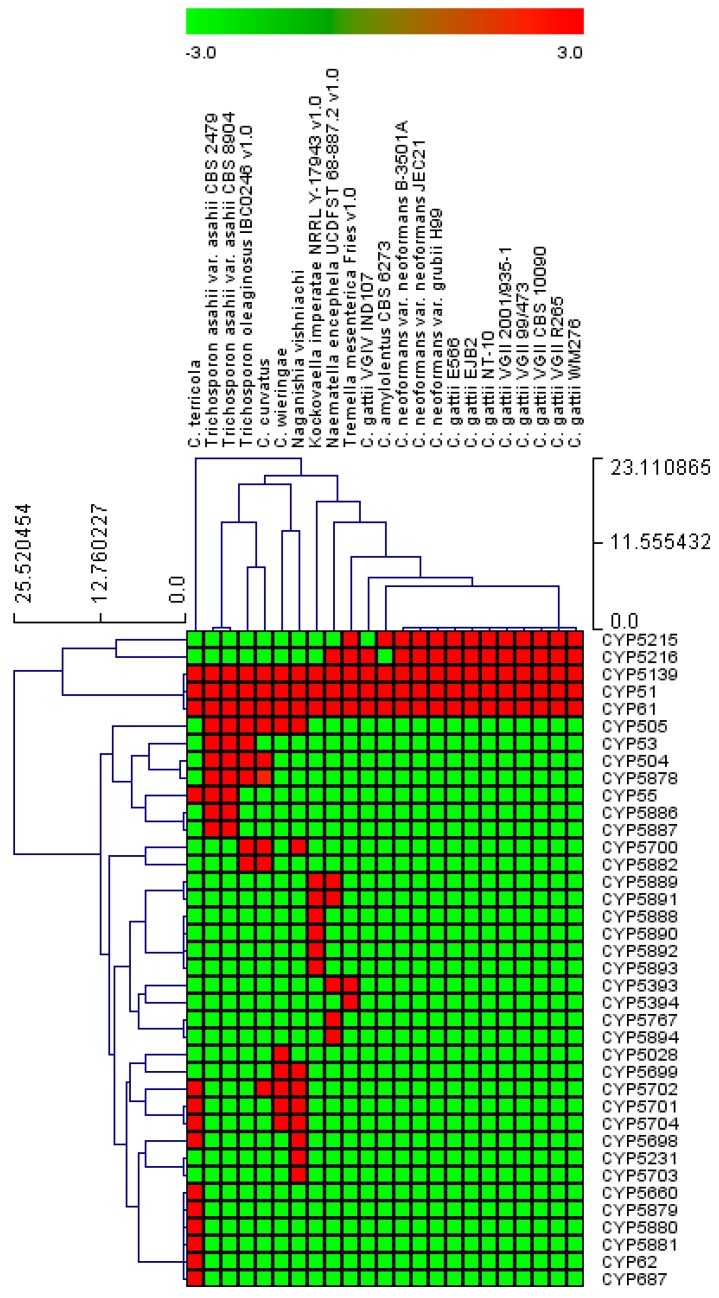
Figure 4.
Heat map representing the presence or absence of cytochrome P450 families in 23 species of Tremellomycetes. The data have been represented as −3 for gene absence (green) and 3 for gene presence (red). Twenty-three species of Tremellomycetes form the horizontal axis and CYP families form the vertical axis. The data used in the generation of Figure 4 are presented in Supplementary Dataset 2, sheet 2.

