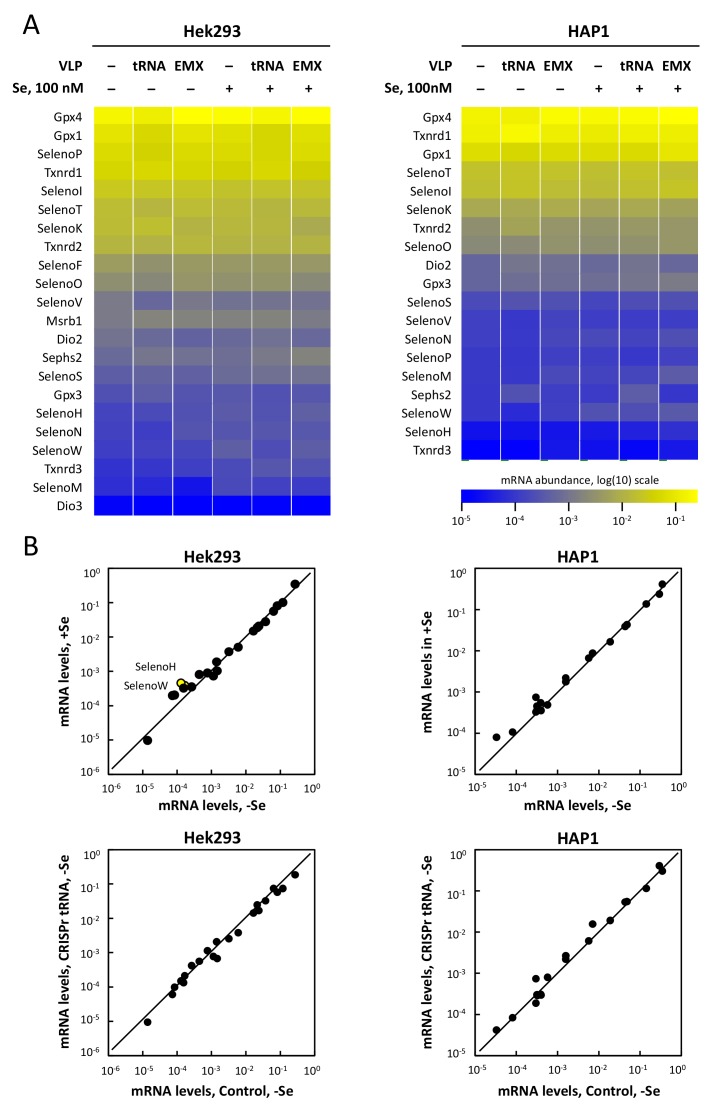
Figure 8.
Evolution of selenoprotein mRNA levels in response to the CRISPR-Cas9-VLP treatments and/or addition of selenium (100 nM) in Hek293 and HAP1 cell lines. (A) The RNA extracts used in Figure 6 were also used for RT-qPCR analysis to measure selenoprotein and housekeeping mRNA levels. The geometrical mean of five housekeeping genes (Hpcb, Rps13, rRNA 18S, Hrpt, and Gapdh) was used to normalize mRNA abundance. Selenoprotein mRNA levels are represented in logarithmic scale in a heatmap. The values are given in Table S2 and Table S3. (B) To validate the stability of steady state levels of selenoprotein mRNAs, the values obtained in control conditions (no VLP, no added Se) were plotted as a function of values obtained with 100 nM Se (top histograms) or with tRNA VLP treated conditions (bottom histograms) in a logarithmic scale. For clarity reasons, only mRNAs for which a minimum of two-fold difference (and p-value below 0.05) were represented in yellow circle and labeled in the graphs.

