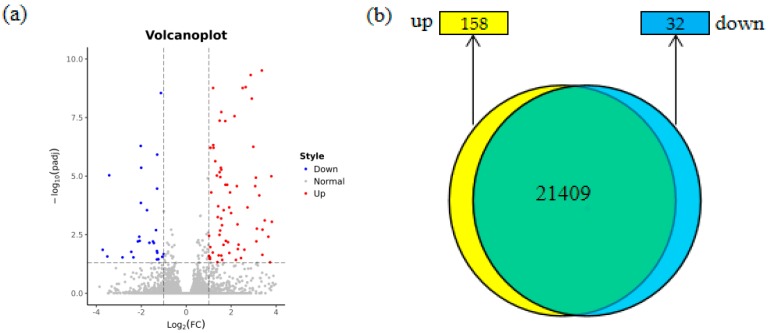
Figure 5.
Differentially expressed genes in transgenic lines expressing PITG_15718.2 compared with the wild type. (a) Volcano plot showing fold change and adjusted p-value of normalized read counts of the RNA-Seq data. The criteria of log2|(fold change)| ≥ 1 and padj ≤ 0.05 were used to identify the differentially expressed genes (DEGs). Blue dots indicate the downregulated DEGs (32 genes), and red dots indicate the upregulated DEGs (158 genes); (b) Venn diagram showing the overlap of the DEGs between the transgenic and wild type groups. The sum of all the numbers in the figure represents the total number of genes in the comparison. The overlapping region indicates the number of genes that were not significantly different between the groups. The yellow label indicates the number of upregulated DEGs and the cyan label indicates the number of downregulated DEGs according the set thresholds.

