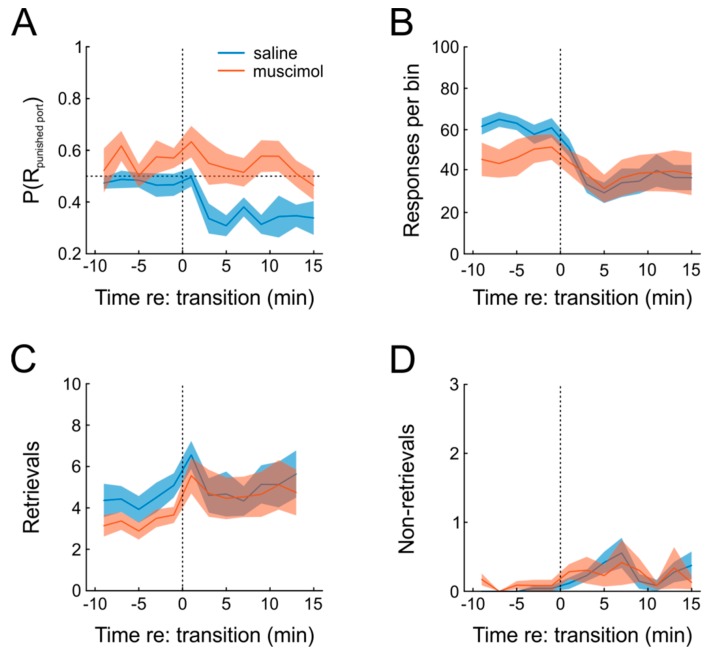
Figure 5.
Adaptation to punishment and involvement of mPFC. (A) Mean P(RL) in consecutive, non-overlapping 2-min bins across animals after saline (blue) or muscimol (red) infusion. P(RL) was rectified, such that values <0.5 signify a preference for the unpunished response port. Under saline, the animals exhibited a clear preference for the non-punished option. Vertical dotted line highlights the time of punishment introduction. (B) As in (A), but showing operant responses. (C) As in (A), but showing the number of rewards retrieved per time bin. (D) As in (A), but showing the number of non-retrieved rewards in all panels. Shading represents SEM.

