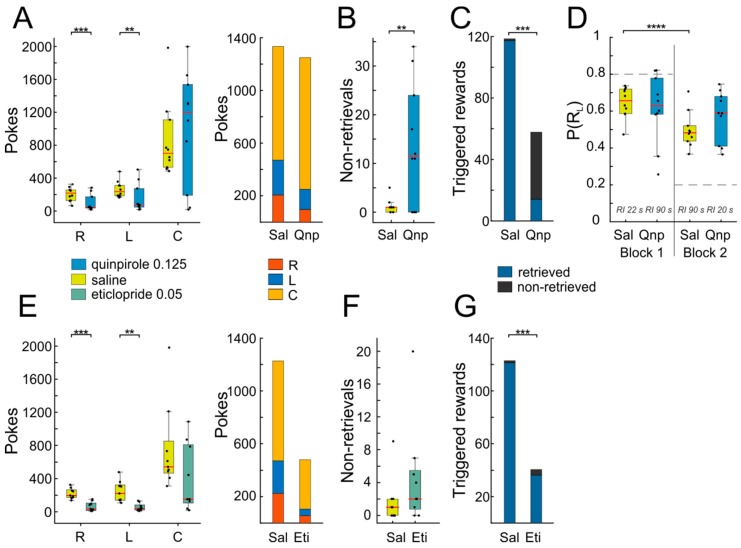
Figure 6.
Systemic administration of dopamine D2-receptor compounds alters task performance. (A) Left: Quinpirole administration reduced overall responding to both response ports (L and R), but not at the reward port (C). Right: Total number of pokes at the L, R and C ports displayed separately for saline (Sal) and quinpirole (Qnp). (B) Quinpirole significantly increased the number of non-retrieved rewards. (C) A total number of triggered rewards with those that were retrieved in blue and those that were not retrieved in black. (D) P(RL) before (Block 1) and after (Block 2) mid-session change in the reward schedule, which required the animals to adapt their responses to the reversed reward ratio as in the first half of the session. Animals changed their responses, according to the reinforcement ratio (indicated in the graph) after saline administration, but not after quinpirole administration. Dashed horizontal lines indicate optimal behavior as predicted by the Matching law. (E–G) As in A–D, but for behavior after eticlopride vs. vehicle administration. In all box plots, individual data points (black dots) are laid over a box depicting the 25th and 75th percentiles; the horizontal red mark indicates the median, whiskers extend to the most extreme observations, outliers are plotted individually. Asterisks indicate significant differences between drug and vehicle as determined by paired samples t-tests (** ≤ 0.01, *** ≤ 0.001, **** ≤ 0.0001).

