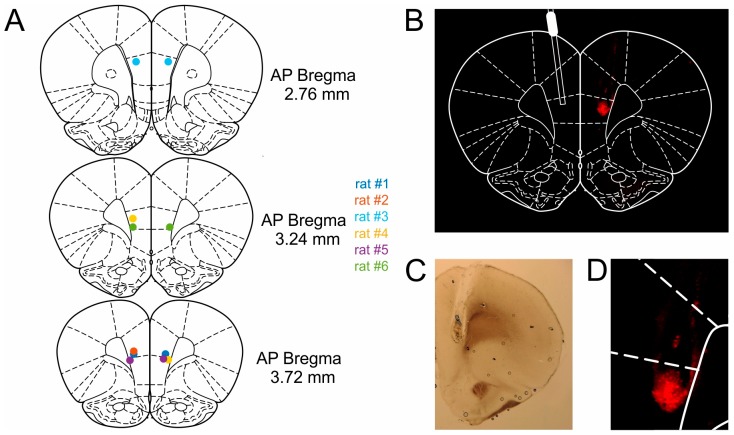
Figure 7.
Bilateral microinfusion sites in the mPFC. (A) Cannula locations in mPFC, colored dots represent cannula tips of individual rats. Brain diagrams adapted from Reference [66]. (B) Coronal slice of the right hemisphere with Evans Blue fluorescence region (right) and schematic representation of the guide cannula (left). The fluorescence is restricted to the prelimbic portion of mPFC. (C) Image of a coronal slice under bright field illumination. (D) Magnified image of the Evans Blue spread shown in (B).

