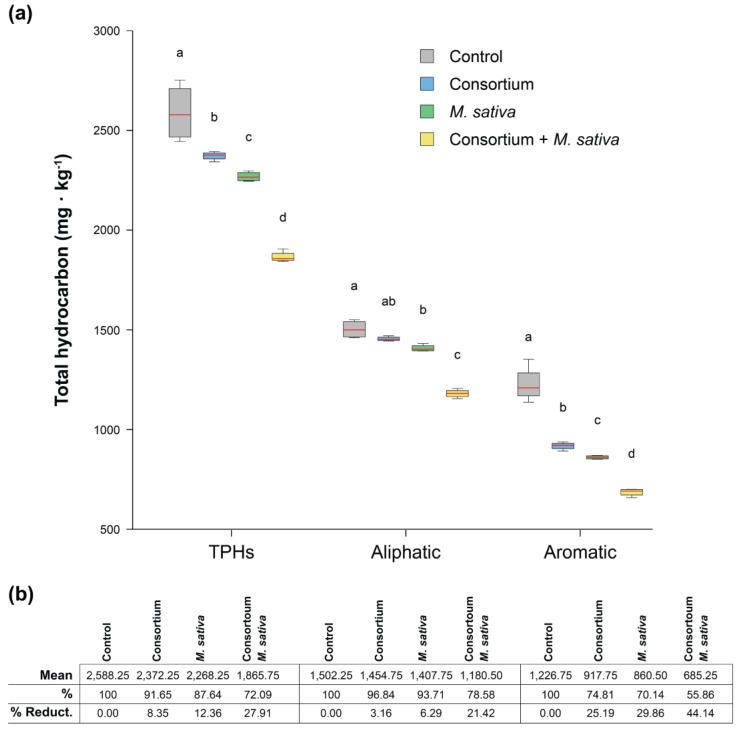
Figure 5.
(a) Gas chromatography with a flame ionized detector (GC-FID) results of total hydrocarbons remaining after four-month treatments with the diesel-degrading consortium, alfalfa (M. sativa) plants without inoculum, and combined consortium and alfalfa plants in four-month microcosms assays. Each box indicates Q1 and Q3, while the red line indicates the median values out of four replicates. Error bars indicate maximum and minimum values. Different letters indicate statistically significant differences (p < 0.05) using two-way ANOVA with Tukey’s multiple comparison test corrections. (b) Mean values in each treatment in mg·kg−1 out of four replicates and percentages compared to the control.

