Figure 2.
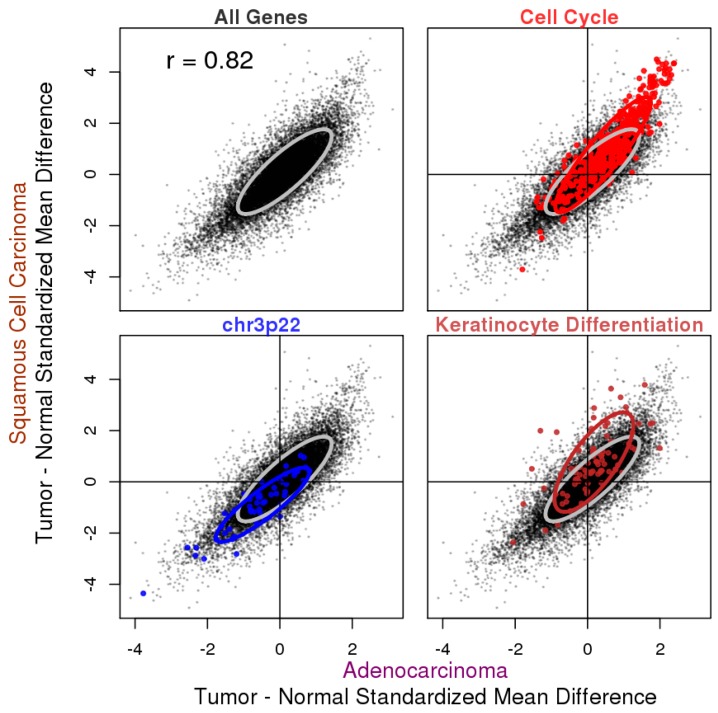
Tumor: the normal standardized mean expression difference in ADC and SQCC with selected genes highlighted. Summary tumor: the normal standardized mean difference from the meta-analysis was plotted for all genes, with results from ADC on the x-axis and results from SQCC on the y-axis. The Pearson correlation coefficient for all genes was 0.82. Genes from three selected gene sets were highlighted: the cell cycle gene set from REACTOME_CELL_CYCLE in c2.cp curated the canonical pathway gene sets collection, chr3p22 genes were from the c1 positional gene sets collection and keratinocyte differentiation genes were from GO_KERATINOCYTE_DIFFERENTIATION in the c5.bp GO biological process gene sets collection in MSigDB. Note that the majority of cell cycle genes were upregulated and the majority of chr3p22 genes were downregulated in the tumors of both histological subtypes, whereas the keratinocyte differentiation genes were specifically upregulated in the SQCC tumors. Ellipsoidal boundary wrapped around the 75% highest density/minimum volume for all genes (gray) or selected genes (non-gray colors).

