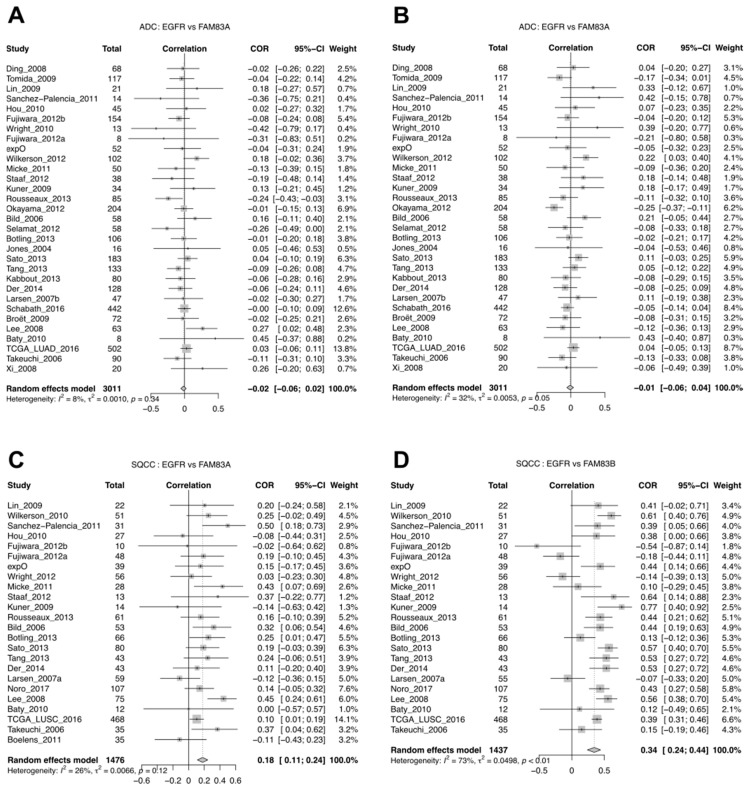
Figure 7.
Meta-analysis of correlation in ADC and SQCC for FAM83A and B vs. EGFR expression. (A) Forest plot for the correlation between FAM83A and EGFR in ADC. (B) Forest plot for the correlation between FAM83B and EGFR in ADC. (C) Forest plot for the correlation between FAM83A and EGFR in SQC. (D) Forest plot for the correlation between FAM83B and EGFR in SQC.

