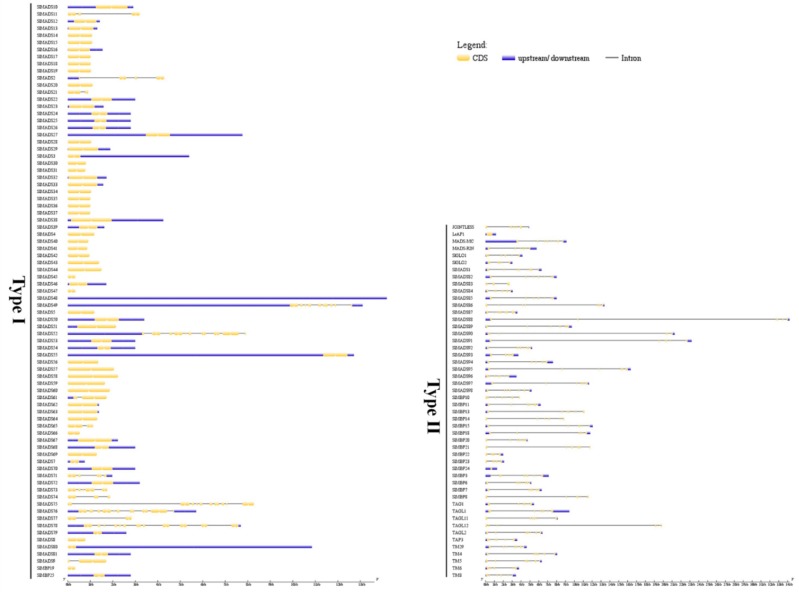
Figure 1.
Gene structure analysis of MADS-box genes in tomato. The Gene Structure Display Server (GSDS) database was used to perform the exon–intron structure analyses. Lengths of exons and introns of each MADS-box gene were displayed proportionally. The blue boxes represent upstream/downstream, the yellow boxes represent exons, and the black lines represent introns.

