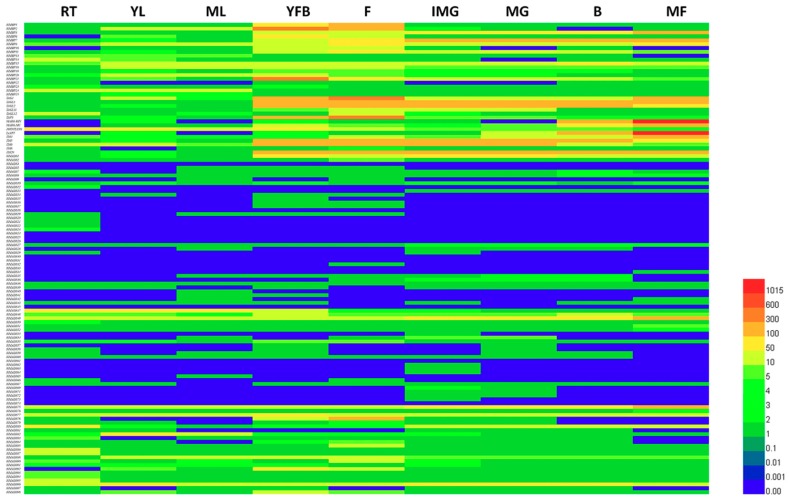
Figure 4.
Heat map representation of tomato MADS-box genes in various tissues. The tissues included the whole root (Rt), young leaf (YL), mature leaves (ML), young flower buds (YFB), and fully open flowers (F), which were at the immature green (IMG), mature green (MG), break (B), and mature (MF) stages of fruit development and ripening. The bar at the bottom of the heat map represents relative gene expression values.

