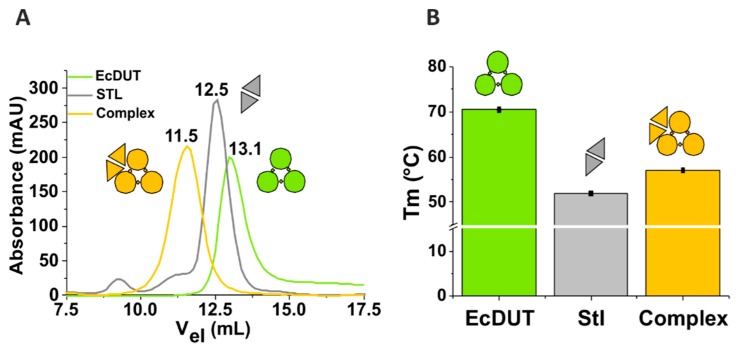
Figure 1.
Complex formation between EcDUT and Stl. Data and symbols for EcDUT, Stl and their mixtures are shown in green, grey, and yellow colors, respectively. Pictograms show the oligomeric assembly characteristic for each species. (A) Size-exclusion chromatography. Peak elution volumes are marked with numbers (data in mL) above the elution peaks. (B) Differential scanning fluorimetry. Melting points are plotted as mean values with standard deviations (less than 0.5 °C for all measurement replicates).

