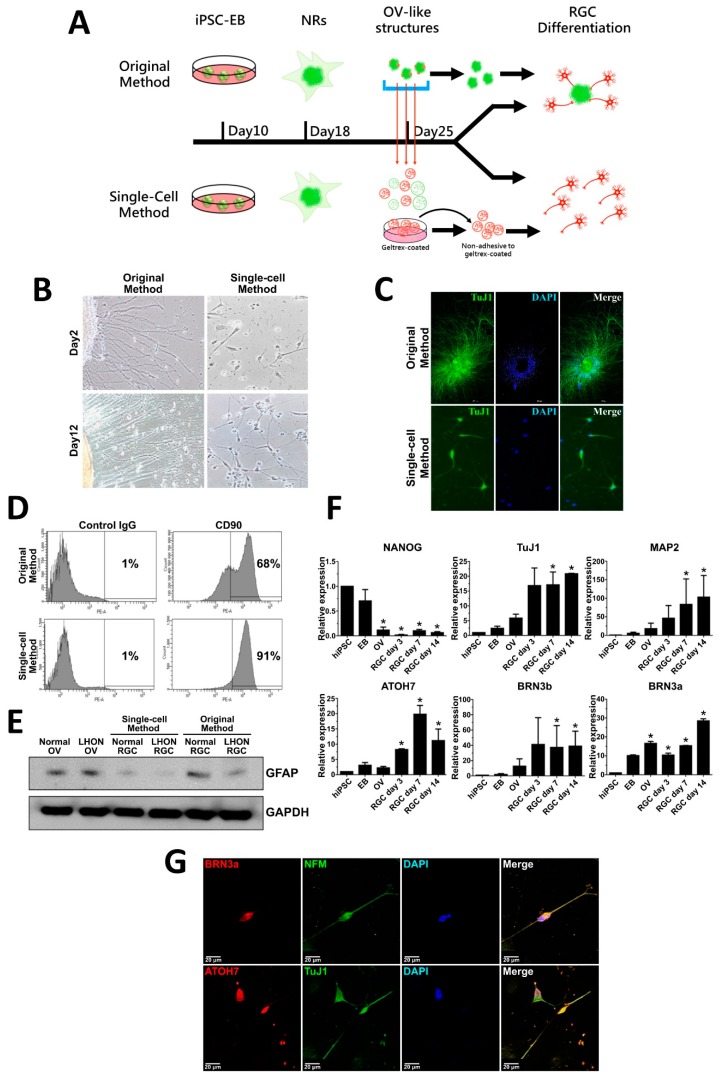
Figure 2.
Differentiation of human-induced pluripotent stem cells (hiPSCs) from retinal ganglion cells (RGCs). (A) Schematic showing the timeline and procedure of differentiation of RGCs from hiPSCs by using the original and modified single-cell methods. (B) Bright field images of 2-day and 12-day normal hiPSC-derived RGCs obtained by the original and single-cell methods. (C) Immunostaining of RGC marker TuJ1 in the normal hiPSC-derived RGCs obtained by both methods. (D) Flow cytometry analysis of the proportion of CD90-expressing 21-day normal hiPSC-derived RGCs obtained by both methods. (E) Western blot showing expression of glial marker GFAP in the population of 21-day normal hiPSC-derived RGCs obtained by both methods. (F) qRT-PCR analysis of expression of neuronal/RGC markers and pluripotency marker NANOG in a time course of differentiation of hiPSCs to RGCs at the indicated stages. The mean fold change relative to hiPSC from three biological replicates is shown with standard deviation error bars. EB—embryoid body, NR—neural rosette, OV—optic vesicle, RGC—retinal ganglion cell, hiPSC—human-induced pluripotent stem cell. * p < 0.05 (Student’s t-test) as compared to hiPSC. (G) Immunostaining showing expression of RGC-specific markers BRN3a, NFM, ATOH7 and TuJ1 in 21-day normal RGCs obtained by single-cell method. Nuclei stained with DAPI. Scale bar: 20 µm.

