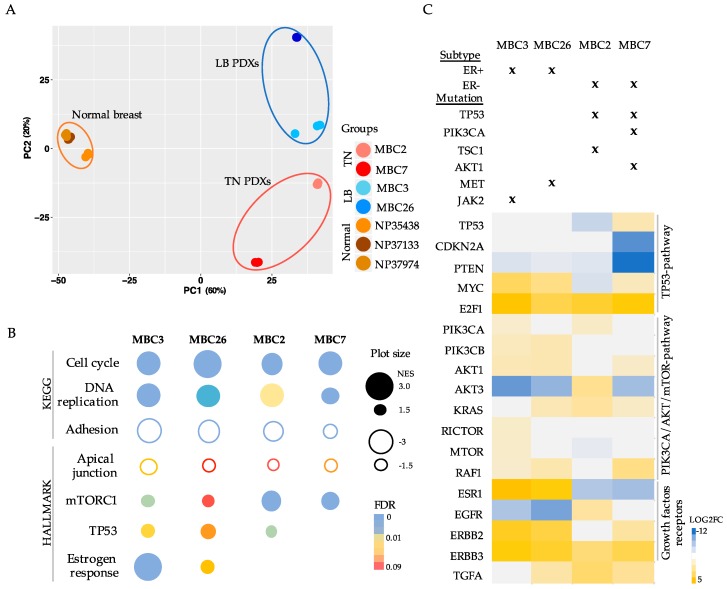
Figure 3.
Transcriptomic/genomic profiles of breast cancer PDXs revealed alternative actionabilities. (A) Principal component analysis (PCA) score plot of gene expression data from RNA-seq of three normal breast tissues, two LB, and two TN PDXs (n = 3 replicates) with the two first principal components (PC1 and PC2) plotted on the x-axis and y-axis, respectively. (B) Representative Gene Set Enrichment Analysis (GSEA) based on KEGG and HALLMARK databases of each PDX in comparison with normal breast. Plot size indicates Normalized Enrichment Score (NES) (fill plots up-regulation; empty plots down-modulation); colors indicate False Discovery Rate (FDR) values. (C) Complementary genomic/transcriptomic data of each PDX was considered. Positivity (+) or negativity (−) to estrogen receptors (ER) is reported. Mutations of genes belonging to TP53 or PI3K/AKT/mTOR pathways are represented with an “x” in each PDX. Heatmap represents LOG2 fold change (FC) values of genes of the aforementioned pathways.

