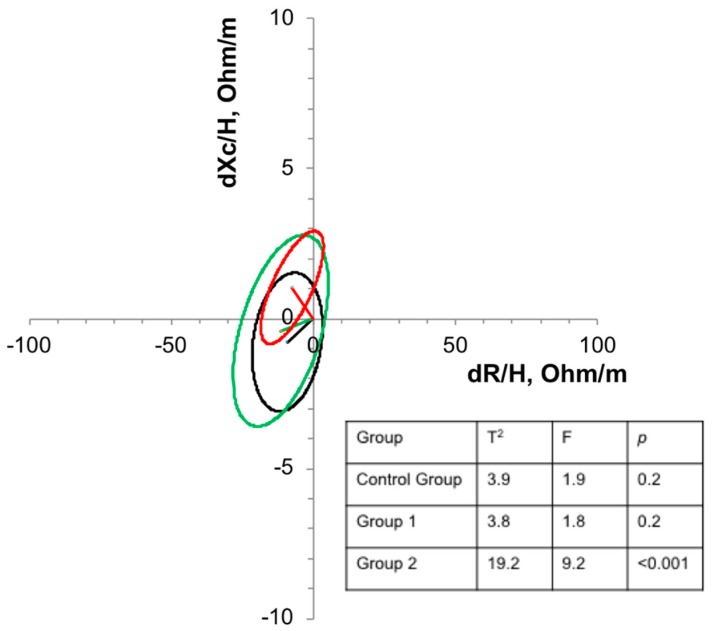
Figure 3.
Confidence ellipses of 95% of impedance vectors measured before (T0) and after (T1) three months of intervention with oral supplementation with different concentrations of zinc in eutrophic children. Black ellipse = control group; Green ellipse = Group 1; Red ellipse = Group 2. An upward or downward displacement of the main axis is associated with more or less soft tissue cell mass, respectively.

