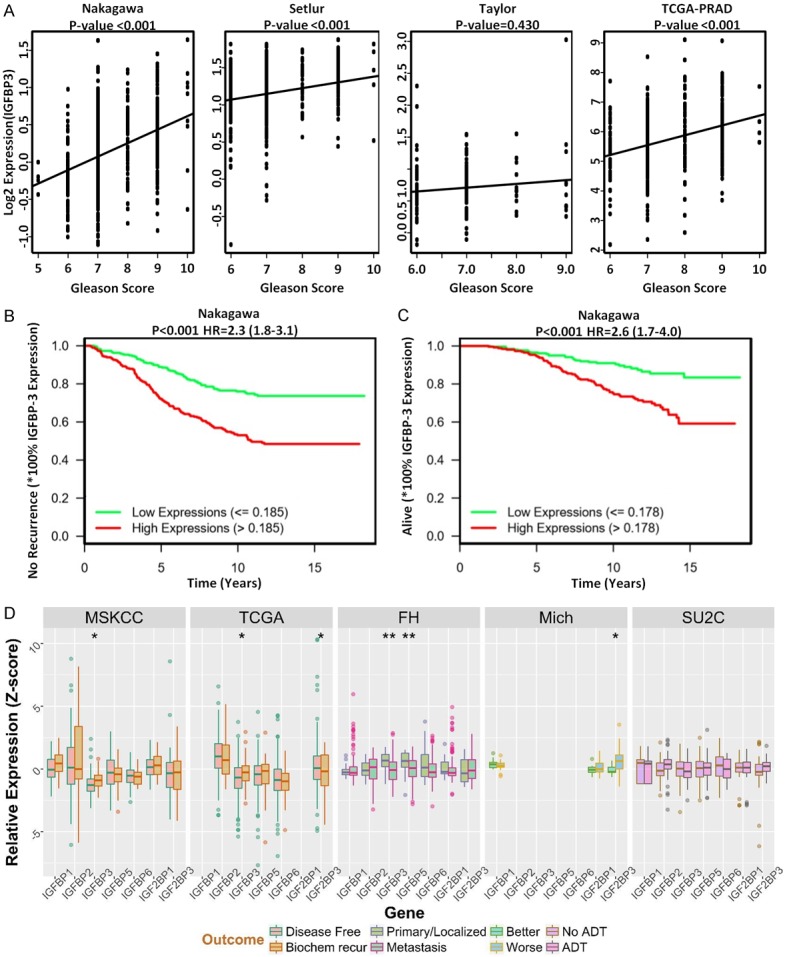
Figure 7.

TCGA Analysis of IGBP3 Expression in Human Prostate Cancer Patient Cohorts. (A) Reveals IGFBP3 expression data and associated clinical information from Nakagawa et al (n=596), Setlur et al (n=363), Taylor et al (n=185), TCGA PRAD (n=498) were downloaded from Oncomine (https://www.oncomine.org/) or GDC (https://portal.gdc.cancer.gov/projects/TCGA-PRAD). The Spearman’s correlation coefficient was calculated, to quantify the correlation between IGFBP3 expression and Gleason score. (B and C) Indicate Kaplan-Meier curves comparing patients’ survival/disease-free time between high and low IGFBP3 expression subgroups. The proportional hazards model was used to calculate the hazard ratio (HR) and its associated 95% CI. (D) Reveals the genomic analysis of IGFBP proteins (IGFBP1, IGFBP3, IGFBP4, IGFBP5, IGFBP6), using several cohorts of prostate cancer patients (MSKCC, TCGA, FH, Michigan, SU2C); there was no significant difference in IGFBP3 mRNA expression levels between primary and metastatic prostate tumors or therapeutic response to ADT (D).
