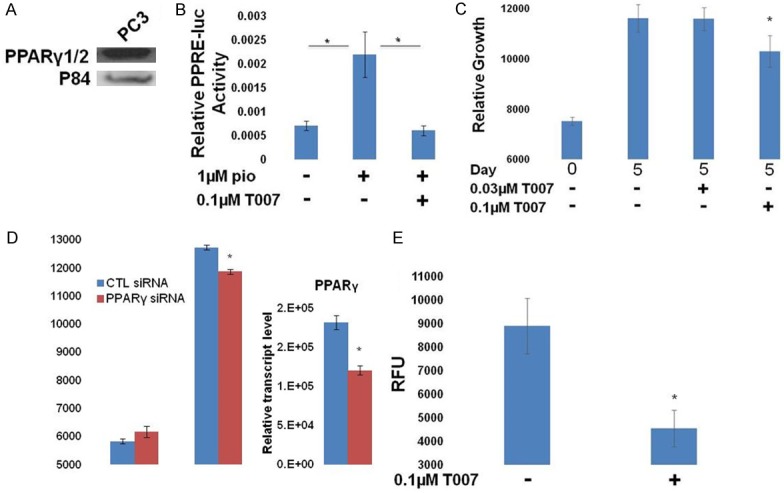
Figure 5.

Effects of PPARγ inhibition in PC3 cells. A. Western blot demonstrating the endogenous expression of PPARγ1 in PC3 cells. B. Cells were transfected with PPRE-luc + pRL SV40 and treated as indicated. The following day, relative luciferase activity was measured. PPARγ activity was stimulated by pio, and inhibited by T007 in PC3 cells (*P<0.05 difference from pio treated cells). C. The growth of PC3 cells relative to day 0 was measured and was found to be sensitive to T007 (*P<0.05 difference from control cells). D. PC3 cells were transfected with control or PPARγ-targeted siRNAs. Growth was measured by DAPI content on day 0 and day 5 and demonstrated that PPARγ knock down inhibited the growth of these cells (left). RT-qPCR analysis demonstrates knockdown of the PPARγ1 transcript (right) (*P<0.05 difference from control cells). E. Colony growth is shown for each condition. Growth of PC3 colonies was inhibited by T007 (*P<0.05 difference from control cells).
