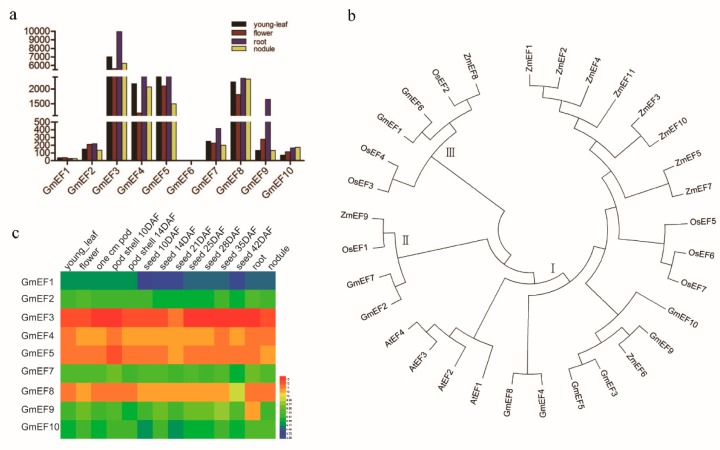
Figure 3.
Differential expression analyses of soybean EF1α family members, neighbor-joining phylogenetic tree of EF1α members from Glycine max (Gm), Arabidopsis (At), Zea mays (Zm), and Oryza sativa (Os), and subcellular localization of GmEF4. (a) Expression data were extracted from soybean transcriptome data in SoyBase. In this respect, a transcriptionally active gene is a gene that has two or more sequence reads at one or more of the tested tissues/developmental stages. (b) Multiple sequence alignment was performed using the Clustal X program, and the phylogenetic tree was constructed using the neighbor-joining method. AtEF1 (AT1G07920), AtEF2 (AT1G07930), AtEF3 (AT1G07940), AtEF8 (AT5G60390), OsEF1 (Os04g20220), OsEF2 (Os04g58140), OsEF3 (Os04g50870), OsEF8 (Os01g02720), OsEF5 (Os03g08010), OsEF6 (Os03g08020), OsEF7 (Os03g08050), ZmEF1 (GRMZM2G149768), ZmEF2 (GRMZM2G001327), ZmEF3 (AC233866), ZmEF8 (GRMZM2G154218), ZmEF5 (GRMZM2G343543), ZmEF6 (GRMZM2G057535), ZmEF7 (GRMZM2G153541), ZmEF8 (GRMZM2G084252), ZmEF9 (GRMZM2G028313), ZmEF10 (GRMZM2G151193), and ZmEF11 (GRMZM2G110509). (c) An analysis was performed by the Affymetrix soybean gene chip downloaded in SoyBase (https://www.soybase.org/soyseq/), which included the 10 soybean EF1αs in the different tissues and development stages. The heatmap was drawn using the software HemI.

