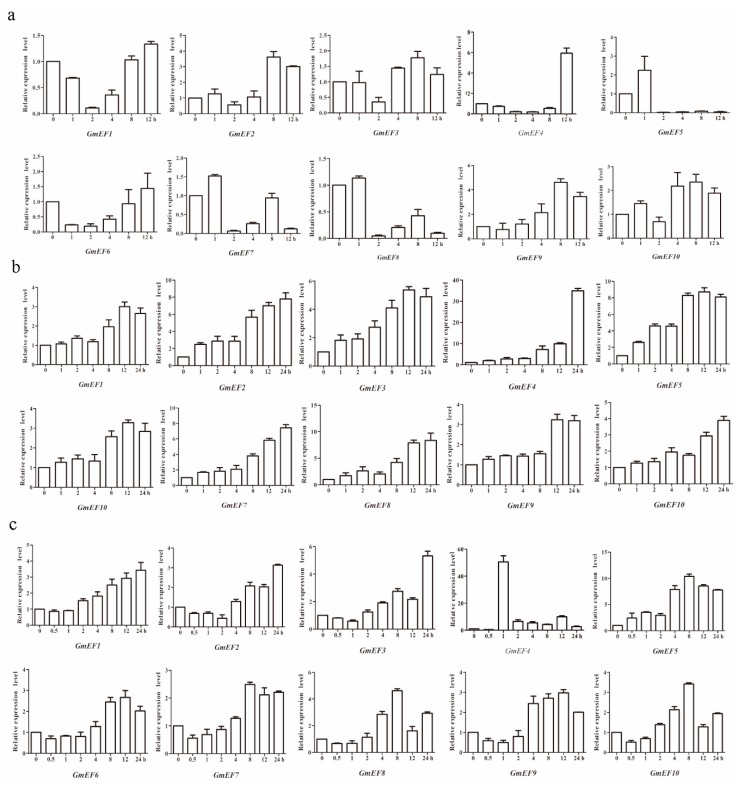
Figure 5.
Expression patterns of soybean EF1αs under drought stress, salt stress, and abscisic acid (ABA) treatment. (a) Expression levels of the 10 soybean EF1α genes under drought stress, as measured using qRT-PCR. Drought treatment was applied for 0, 1, 2, 4, 8, and 12 h. (b) Expression levels of 10 soybean EF1α genes under NaCl treatment for 0, 1, 2, 4, 8, 12, and 24 h. (c) Expression levels of the 10 soybean EF1α genes under ABA treatment, as measured using qRT-PCR. ABA treatment was applied for 0, 0.5, 1, 2, 4, 8, 12, and 24 h. The vertical coordinates are fold changes, and the horizontal ordinates are treatment times. The actin gene was used as an internal reference. The data are shown as means of three biology repeats ± SD.

