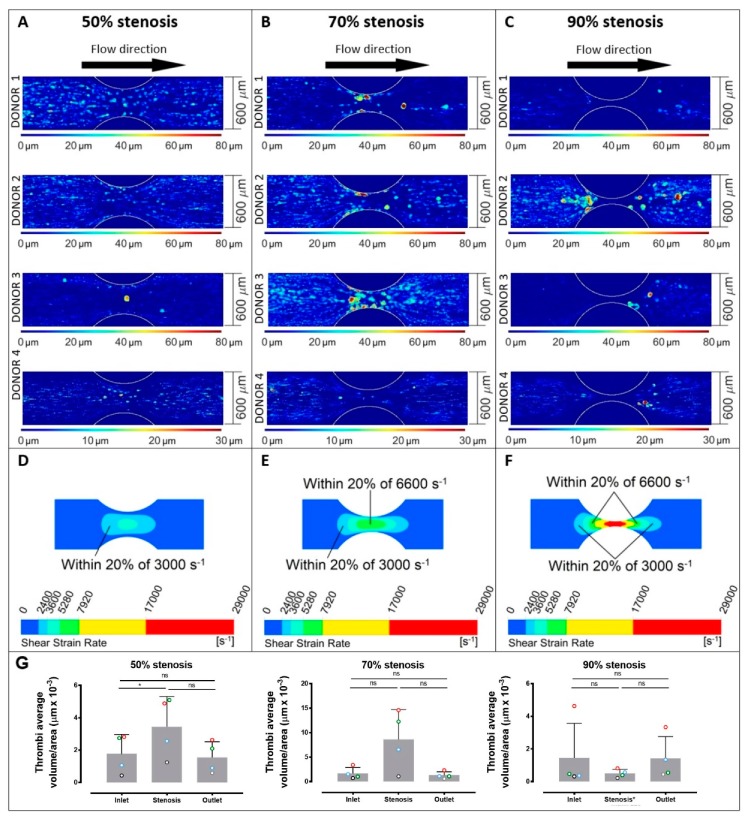
Figure 3.
Platelet thrombus formation in stenosed channels. Images of thrombus formation (demonstrated by contours of thrombus height) all collected under the same conditions from anticoagulated blood from 4 separate donors within collagen-coated channels with 50% stenosis (A), 70% stenosis (B), and 90% stenosis (C) (donors 1–4 are shown from top to bottom panels at each shear rate, and images represent overlays of four consecutive stenoses for each donor). Calculated wall shear patterns are shown for 50% stenosis (D), 70% stenosis (E), and 90% stenosis (F), and thrombi average volume/area (G) are indicated for each donor (open circles; red = donor 1, green = donor 2, blue = donor 3, black = donor 4) at inlet regions, stenotic regions, and outlet regions for 50% stenosis, 70% stenosis, and 90% stenosis, where bars represent mean ± standard deviation. Data in panel (G) were evaluated using one-way ANOVA with Tukey’s correction for multiple comparisons. ns = no significance; * p ≤ 0.05. Pulsatile shear in stenotic channels compared with straight channels at varying shear (Figure 2) supports a specific role for shear gradients in initiating thrombus formation and regulating thrombus growth.

