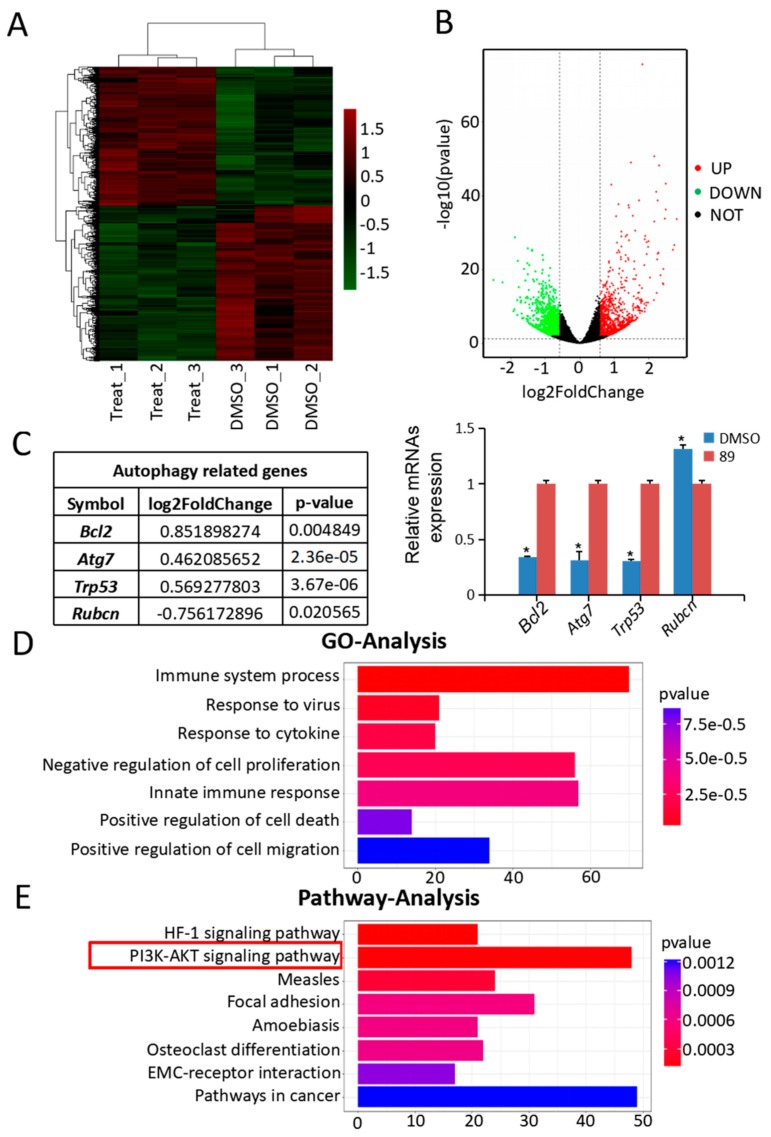
Figure 3.
Analysis and validation of RNA-seq data. (A) Hierarchical clustering shows differentially expressed mRNA patterns between the control and C89-treated groups. (B) Volcano plot of differentially expressed mRNAs. A total of 1983 differentially expressed mRNAs were identified, including 937 upregulated and 1046 downregulated mRNAs. (C) Differentially expressed mRNAs were related to autophagy, and the qRT-PCR results were consistent with the changes in transcriptome profile (p < 0.05). (D) Gene Ontology (GO) analysis of RNA-seq data. The top seven significantly enriched biological processes are shown. (E) Kyoto Encyclopedia of Genes and Genomes (KEGG) pathway analysis of RNA-seq data. The top eight enriched pathways are shown. * p < 0.05, ** p < 0.01, *** p < 0.001.

