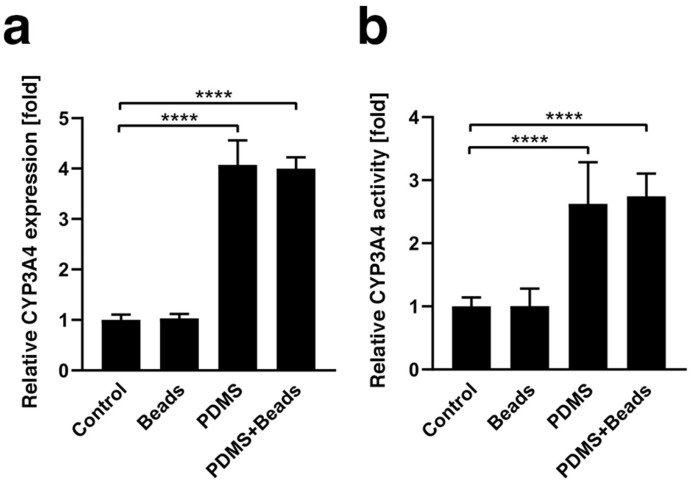
Figure 3.
Gene expression and activity of CYP3A4. (a) CYP3A4 mRNA expression under Control, Beads, PDMS and PDMS + Beads conditions was measured by qPCR using spheroids at culture day 1. The results were normalized by the expression of GAPDH mRNA and are presented as the fold-difference compared with that of the Control condition. (b) CYP3A4 enzyme activity under each condition was measured at day 1 and is presented as the fold-change compared with the Control condition. **** p < 0.0001.

