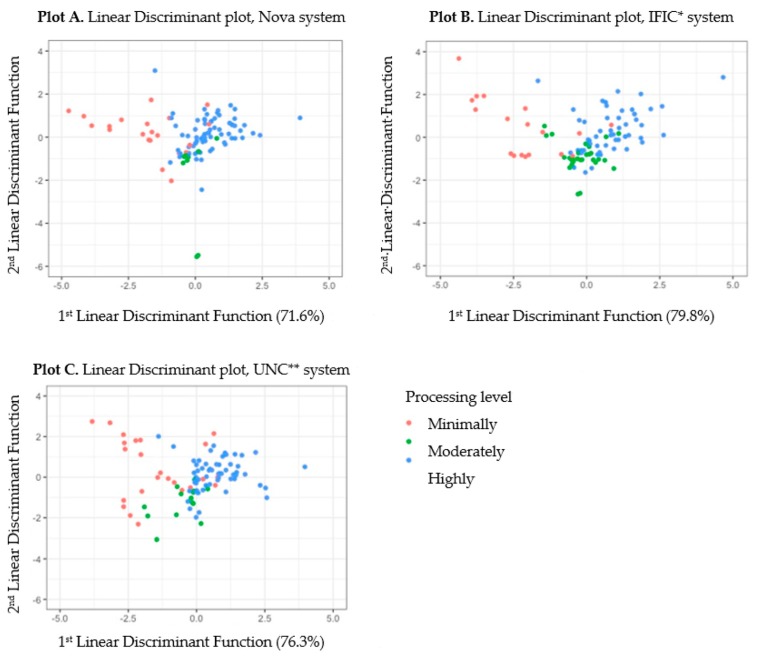
Figure 2.
(A). Linear Discriminant plot, Nova system. (B). Linear Discriminant plot, IFIC * system. (C). Linear Discriminant plot, UNC ** system. The top 100 foods consumed by children 6–12 years old (NHANES 2013–2014) by processing category, plotted within the first two linear discriminants for the * International Food Information Council (IFIC), Nova and ** University of North Carolina at Chapel Hill (UNC) systems according to predicted classification category. Percentage of variance explained by the first and second linear discriminant is included in each figure.

