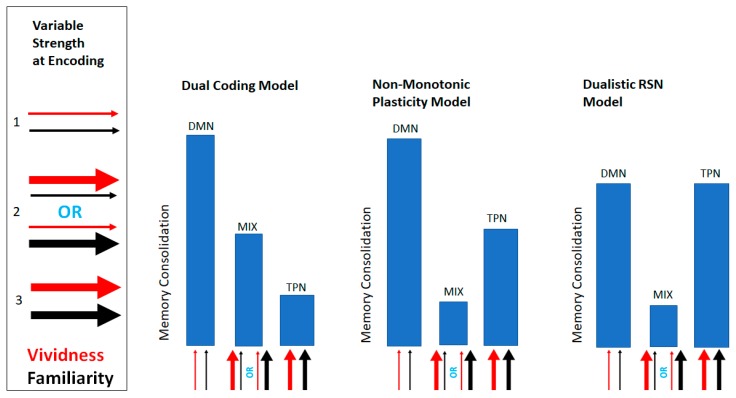
Figure A1.
Schematic depicting the three contrasting models of memory consolidation. Each model depicts its predicted memory consolidation scores in relation to the three possible combinations of variable strength at the time of encoding. The width of the arrows signifies the strength of the variables at encoding.

